Last week, the Federal Housing Finance Agency released its Purchase-Only House Price Index for July. The HPI was down 0.6% from the previous month, although up 13.9% from July 2021. The HPI has increased by nearly 120% since March 2012 (yellow line), and is up 39% since the start of the COVID-19 pandemic in March 2020.
Tag: Edward Seiler
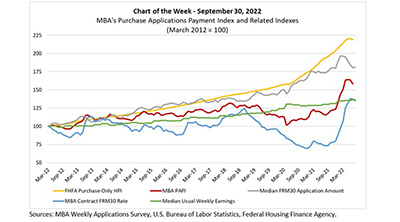
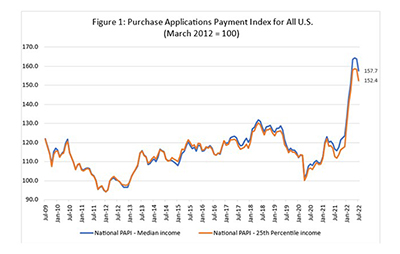
MBA Chart of the Week Sept. 30, 2022: MBA Purchase Applications Payment Index
Last week, the Federal Housing Finance Agency released its Purchase-Only House Price Index for July. The HPI was down 0.6% from the previous month, although up 13.9% from July 2021. The HPI has increased by nearly 120% since March 2012 (yellow line), and is up 39% since the start of the COVID-19 pandemic in March 2020.
MBA: August Homebuyer Affordability Up 3rd Straight Month
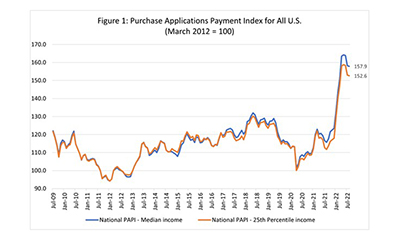
Homebuyer affordability improved in August for the third straight month, with the national median payment applied for by applicants decreasing to $1,839 from $1,844 in July, according to the Mortgage Bankers Association’s Purchase Applications Payment Index.
MBA: August Homebuyer Affordability Up 3rd Straight Month
Homebuyer affordability improved in August for the third straight month, with the national median payment applied for by applicants decreasing to $1,839 from $1,844 in July, according to the Mortgage Bankers Association’s Purchase Applications Payment Index.
MBA Chart of the Week: Rent Growth–Year-over-Year Percentage Change
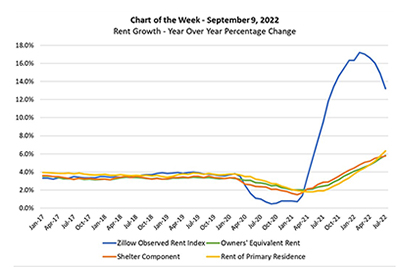
This week’s MBA Chart of the Week highlights a question related to housing costs and inflation: If home price appreciation and rent growth have been in double digits in the past few quarters—as highlighted by the (blue lined) Zillow Observed Rent Index in the chart—why is the shelter component (orange line) of the Consumer Price Index below 6%?
MBA Chart of the Week: Rent Growth–Year-over-Year Percentage Change
This week’s MBA Chart of the Week highlights a question related to housing costs and inflation: If home price appreciation and rent growth have been in double digits in the past few quarters—as highlighted by the (blue lined) Zillow Observed Rent Index in the chart—why is the shelter component (orange line) of the Consumer Price Index below 6%?
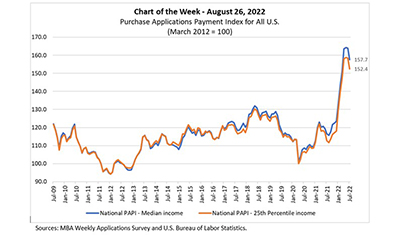
MBA Chart of the Week, Aug. 26, 2022: MBA Purchase Applications Payment Index
In this MBA Chart of the Week, we examine how market transitions are affecting homebuyer affordability.
MBA Chart of the Week, Aug. 26, 2022: MBA Purchase Applications Payment Index
In this MBA Chart of the Week, we examine how market transitions are affecting homebuyer affordability.
MBA: Lower Mortgage Rates, Loan Amounts Improve July Homebuyer Affordability in 47 States
Homebuyer affordability improved for the second straight month in July, with the national median payment applied for by applicants decreasing to $1,844 from $1,893 in June, the Mortgage Bankers Association reported Wednesday.