Home prices and rent appreciation have exceeded income growth since the turn of the 21st century. This has created economic obstacles for many American households, especially for low- and moderate-income renters living in cities with recent employment growth but significant housing supply constraints, according to a new report from the MBA Research Institute for Housing America.
Tag: Edward Seiler
MBA RIHA Study: Affordability Growing Challenge for Low-, Moderate-Income Renters in Majority of Top 50 Metro Areas
Home prices and rent appreciation have exceeded income growth since the turn of the 21st century. This has created economic obstacles for many American households, especially for low- and moderate-income renters living in cities with recent employment growth but significant housing supply constraints, according to a new report from the MBA Research Institute for Housing America.
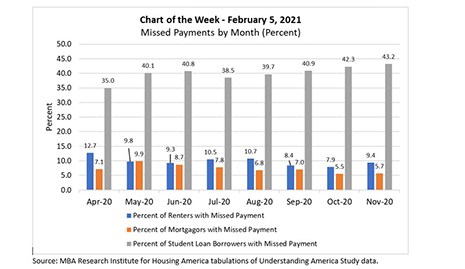
MBA Chart of the Week: Missed Payments By Month (Percent)
This week’s MBA Chart of the Week chart provides a preview of newly updated pandemic-related household financial insights that MBA’s Research Institute for Housing America released this morning, Feb. 8.
MBA RIHA Study Shows Progress, but 5 Million Renters, Homeowners Missed December Payments
Five million households did not make their rent or mortgage payments in December, and 2.3 million renters and 1.2 million mortgagors believe they are at risk of eviction or foreclosure or would be forced to move in the next 30 days, according to fourth-quarter research released today by the Mortgage Bankers Association’s Research Institute for Housing America.
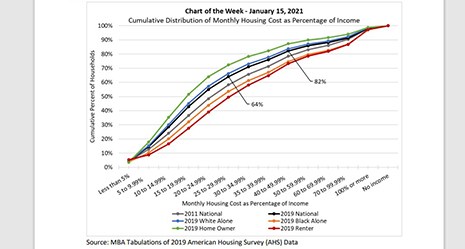
MBA Chart of the Week: Monthly Housing Cost as Percentage of Income
This week’s MBA Chart of the Week uses AHS data to show the distribution of total monthly housing costs as a percentage of income. T
MBA Chart of the Week: Monthly Housing Cost as Percentage of Income
This week’s MBA Chart of the Week uses AHS data to show the distribution of total monthly housing costs as a percentage of income. T
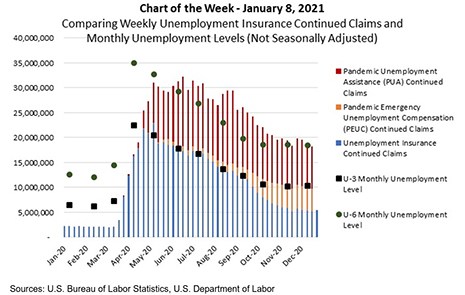
MBA Chart of the Week: Unemployment Insurance Continued Claims
The COVID-19 pandemic continued to impact the labor market to close 2020. Friday’s release from the Bureau of Labor Statistics showed that faster layoffs led to a loss of 140,000 jobs in December and kept the headline unemployment rate (U-3) at 6.7 percent.