This week’s MBA Chart of the Week examines another metric from our PAPI dataset – the mortgage payment to rent ratio. The orange line relates the median principal and interest payment to the median asking rent, and the blue line relates the 25th percentile mortgage application payment to the median asking rent (that may be a more suitable ratio for first-time homebuyers).
Tag: Edward Seiler
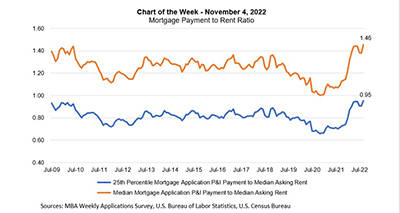
MBA Chart of the Week Nov. 4 2022: Mortgage Payment to Rent Ratio
This week’s MBA Chart of the Week examines another metric from our PAPI dataset – the mortgage payment to rent ratio. The orange line relates the median principal and interest payment to the median asking rent, and the blue line relates the 25th percentile mortgage application payment to the median asking rent (that may be a more suitable ratio for first-time homebuyers).
MBA: Homebuyer Affordability Drops in September Amid Surge in Mortgage Rates
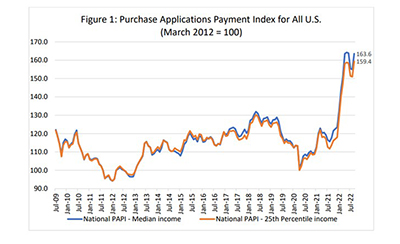
Homebuyer affordability dropped in September, as the national median payment applied for by applicants increased by 5.5 percent to $1,941 from $1,839 in August, according to the Mortgage Bankers Association’s Purchase Applications Payment Index.
MBA: Homebuyer Affordability Drops in September Amid Surge in Mortgage Rates
Homebuyer affordability dropped in September, as the national median payment applied for by applicants increased by 5.5 percent to $1,941 from $1,839 in August, according to the Mortgage Bankers Association’s Purchase Applications Payment Index.
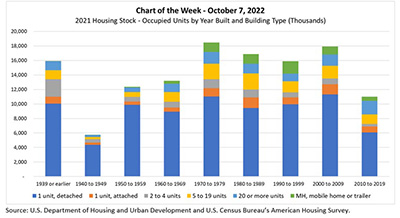
MBA Chart of the Week Oct. 7, 2022: 2021 Housing Stock
In this week’s MBA Chart of the Week, we show the stock of occupied homes in the U.S. by the decade built and by building type. The chart indicates that the housing stock in the U.S. is aging.
MBA Chart of the Week Oct. 7, 2022: 2021 Housing Stock
In this week’s MBA Chart of the Week, we show the stock of occupied homes in the U.S. by the decade built and by building type. The chart indicates that the housing stock in the U.S. is aging.
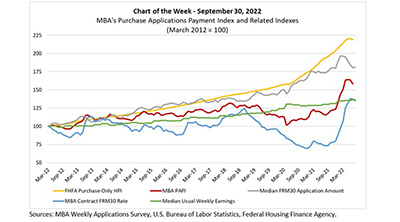
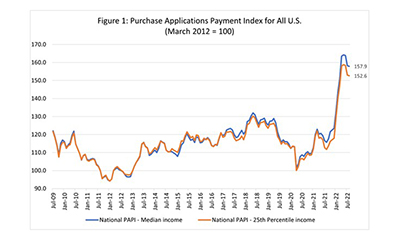
MBA Chart of the Week Sept. 30, 2022: MBA Purchase Applications Payment Index
Last week, the Federal Housing Finance Agency released its Purchase-Only House Price Index for July. The HPI was down 0.6% from the previous month, although up 13.9% from July 2021. The HPI has increased by nearly 120% since March 2012 (yellow line), and is up 39% since the start of the COVID-19 pandemic in March 2020.
MBA: August Homebuyer Affordability Up 3rd Straight Month
Homebuyer affordability improved in August for the third straight month, with the national median payment applied for by applicants decreasing to $1,839 from $1,844 in July, according to the Mortgage Bankers Association’s Purchase Applications Payment Index.