MBA Chart of the Week Mar. 11, 2022: MBA Weekly Applications Survey Purchase Loan Size
House price appreciation continued to rise rapidly in the fourth quarter.
The Federal Housing Finance Agency’s Purchase-Only House Price Index increased by 17.5% from fourth quarter 2020, and it grew by more than 27% in Idaho, Utah and Arizona. There have been various explanations given for the record-setting appreciation in recent months—mainly the imbalance between housing demand and supply. In addition, some housing analysts have explained the strong appreciation in locations where people migrated to during the pandemic as “location arbitrage”—where movers could take advantage of the vastly different home prices across metros and regions.
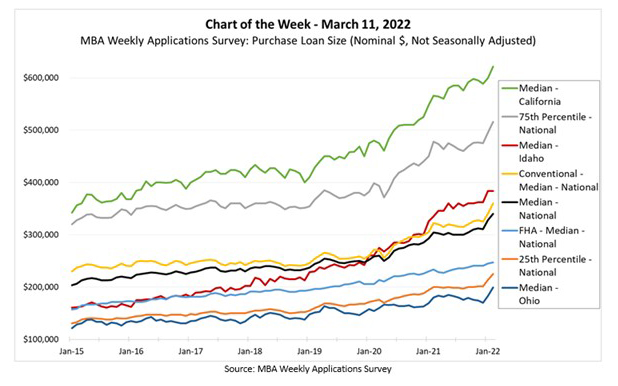
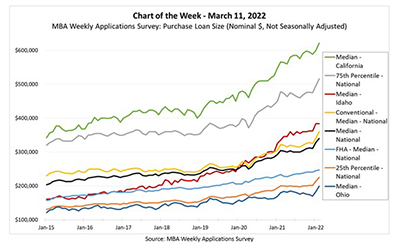
With increasing home prices, it is instructive to understand how home purchase mortgage origination amounts have increased. In this week’s MBA Chart of the Week, we examine how the loan size for fixed-rate 30-year purchase mortgage applications has changed since 2015 using MBA’s Weekly Applications Survey data.
The median amount for all loans in the U.S. (black line) increased from $204,024 in January 2015 to $327,983 in January – an average yearly increase of 7.0%. The median loan amount increased by 11.8% from January 2021 to January 2022, and by 3.7% month-on-month to February ($340,000). Similarly, the 25th percentile for all loans—where 25% of applications had a lower amount and 75% a higher amount—increased by 7.3% per annum over the seven years ending in January, and by 10.1% in the 12-months ending January (orange line). Interestingly, the median series for Ohio (dark blue) is lower than the national 25th percentile in all months—with a gap of $25,500 in February. The 75th percentile national series (gray) reached $516,000 in February—$105,600 lower than California’s median application amount (green line).
The Weekly Applications Survey also gives us the ability to look at conventional and government loans separately. The national application amounts for FHA loans (light blue) lies between the 25th percentile and the median series, and the series for conventional loans (yellow) lies above the median series.
The final series we show is for Idaho (red “transversal” line). The median loan size in Idaho has increased, on average, by 13.2% per annum over the seven years ending in 2021 (versus 7.0% nationally). It increased by 17.8% in 2021 but was flat between January and February (when the national median increased 3.7% month-on-month).
- Edward Seiler (eseiler@mba.org), Joel Kan (jkan@mba.org), Anh Doan (adoan@mba.org)