
MBA recently released its March Purchase Applications Payment Index data which revealed that homebuyer affordability took another hit in March with the typical homebuyer’s monthly payment eclipsing $2,200 for the first time in the series.
Tag: MBA Chart of the Week
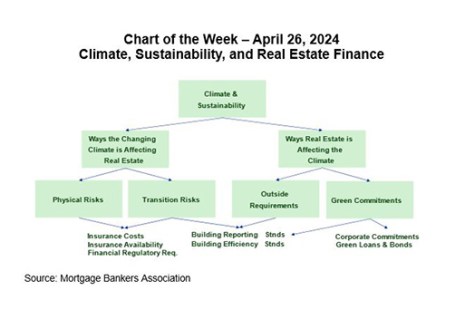
MBA Chart of the Week: Climate, Sustainability and Real Estate Finance
With Earth Day happening this month, it seems an opportune time to discuss the intersection of climate/sustainability issues and real estate finance. MBA has been leading on these issues for more than half a decade, helping members through our work related to research, policy and practice.
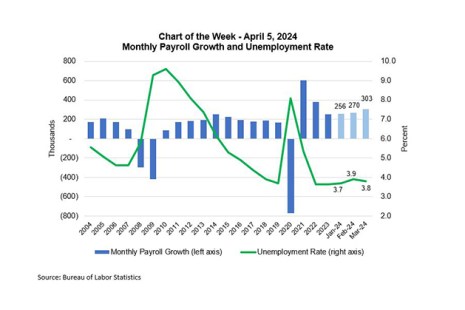
MBA Chart of the Week: Payroll Growth and Unemployment
Our Chart of the Week focuses on Friday’s Employment Situation report released by the Bureau of Labor Statistics.
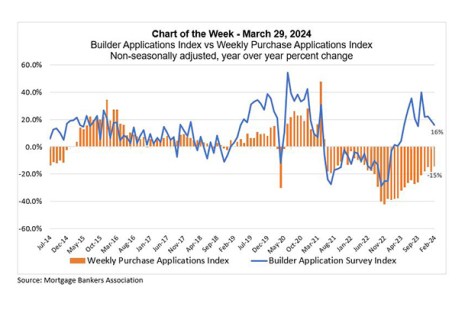
MBA Chart of the Week: Builder Applications Index Vs. Weekly Purchase Applications Index
As we enter the spring home-buying season, existing-home sales activity remains suppressed by low levels of for-sale inventory.
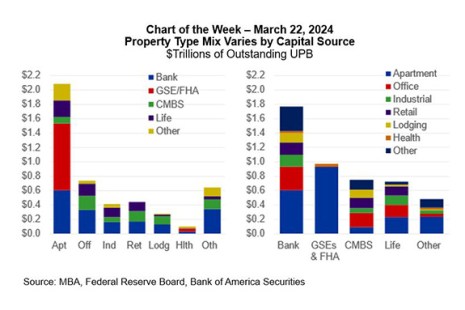
MBA Chart of the Week: CRE Mortgage Debt Across Capital Sources, Property Types
This week’s Chart of the Week shows MBA’s estimates of the distribution of CRE mortgage debt across capital sources and property types and is derived from a variety of public and private sources.
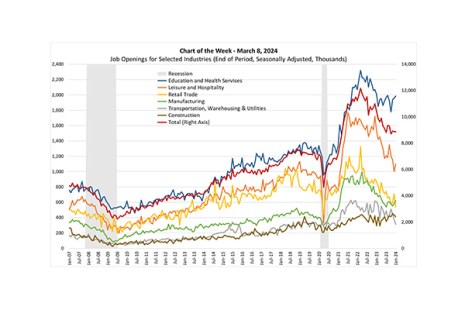
MBA Chart of the Week: Job Openings for Selected Industries
Last week Fed Chair Jay Powell testified to Congress that as “labor market tightness has eased and progress on inflation has continued, the risks to achieving our employment and inflation goals have been moving into better balance.”
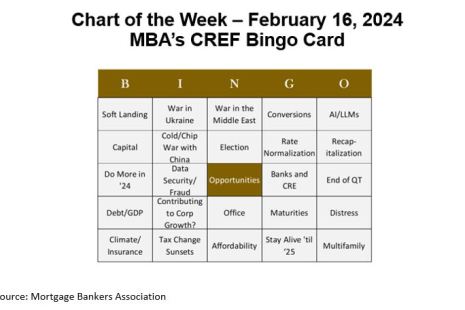
Chart of the Week: MBA’s CREF Bingo Card
Many of us just returned from MBA’s Commercial Real Estate/Multifamily Finance Convention and Expo. That means we showcased our annual CREF BINGO card, highlighting the topics expected to be discussed in sessions, meetings, hallways and over drinks.
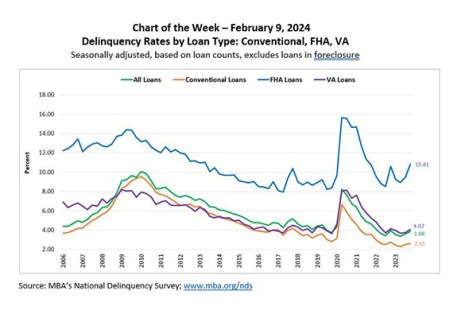
MBA Chart of the Week: Delinquency Rates by Loan Type
According to the latest MBA National Delinquency Survey, the overall delinquency rate for mortgage loans on one‐to‐four‐unit residential properties increased to a seasonally adjusted rate of 3.88 percent of all loans outstanding at the end of the fourth quarter.
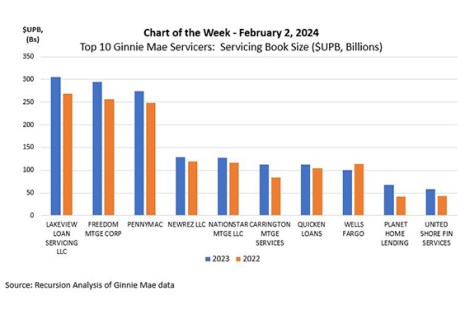
MBA Chart of the Week: Top 10 Ginnie Mae Servicers
This week’s MBA Chart of the Week highlights analysis by Recursion, a big data mortgage analytics firm, that ranks the 10 largest Ginnie servicers by servicing book size ($UPB).
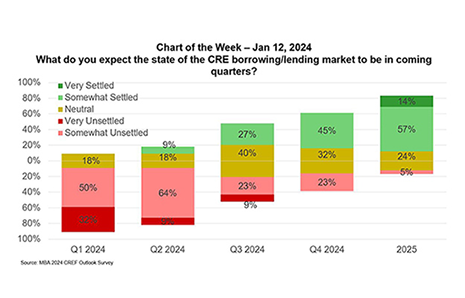
MBA Chart of the Week: Expectations for the CRE Borrowing/Lending Market
Even though many commercial real estate loans are long-lived, there’s a sense that the industry starts each year fresh. Sometimes, that means losing credit for all the deals and successes of the previous twelve months. Sometimes – like now – it means being able to put last year in the rearview mirror.