
Since World War II, the consensus among economists has been pro-free trade with the attitude to tariffs summed up by JP Morgan’s David Kelly:
Tag: MBA Chart of the Week

Chart of the Week: New Home Sales by Stage of Construction
As home builders have increased production levels to meet recent demand for homes, residential housing starts and permits, and new home sales have continued at a relatively strong pace through early 2025.
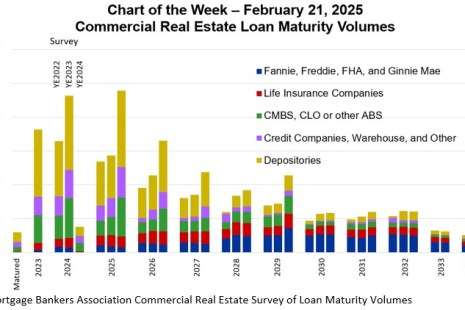
Chart of the Week: CRE Loan Maturity Volumes
Twenty percent ($957 billion) of $4.8 trillion of outstanding commercial mortgages held by lenders and investors will mature in 2025, a 3 percent increase from 2024, according to MBA’s 2024 Commercial Real Estate Survey of Loan Maturity Volumes.
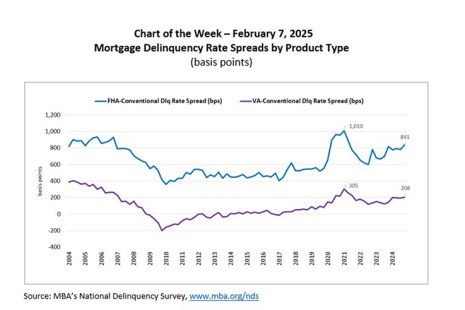
Chart of the Week: Mortgage Delinquency Rate Spreads by Product Type
According to the MBA’s National Delinquency Survey, the overall delinquency rate for mortgage loans on one‐to‐four‐unit residential properties increased to a seasonally adjusted rate of 3.98% of all loans outstanding at the end of the fourth quarter.
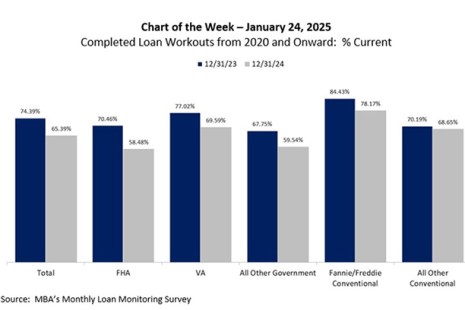
Chart of the Week: Completed Loan Workouts from 2020 Onward
According to the latest results from MBA’s Monthly Loan Monitoring Survey, approximately 235,000 homeowners are in forbearance plans as of December 31, 2024.
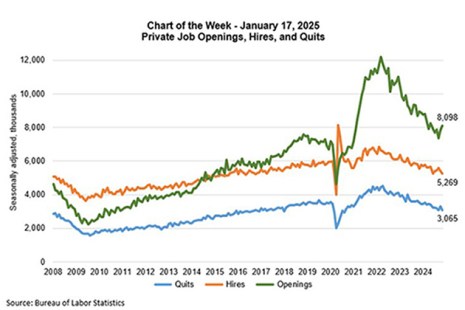
MBA Chart of the Week: Private Job Openings, Hires and Quits
As we highlighted in a previous Chart of the Week, the share of workers who were unemployed for longer spells has increased, implying that even though the job market is generally strong, it has been harder for those workers who have lost jobs to regain employment.
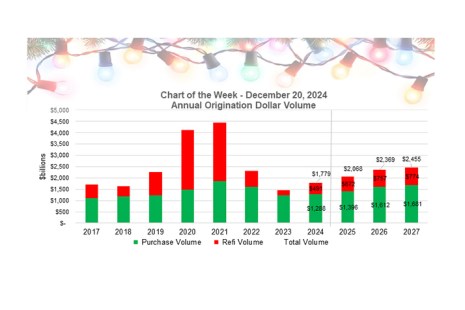
MBA Chart of the Week: Annual Origination Dollar Volume
At its December meeting, the FOMC cut their rate target by another 25 basis points as the market had anticipated.

Chart of the Week: Unemployment by Duration
Fed officials have pointed to their “data dependence” regarding decisions about future rate cuts. These November employment data support a cut at the December meeting and MBA forecasts that the Fed will continue to reduce short-term rates in 2025, although they are likely to slow the pace of cuts.
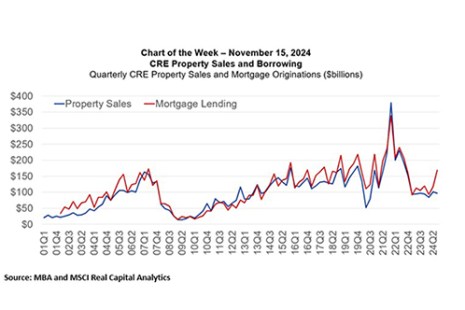
Chart of the Week: CRE Property Sales and Borrowing
After a slow start to this year, borrowing and lending backed by commercial real estate properties picked up during the third quarter. Originations increased 59 percent compared to a year ago and increased 44 percent from the second quarter of 2024.

Chart of the Week: 10-Year Treasury and 30-Year Fixed Mortgage Rates
Both Treasury yields and mortgage rates declined from April to September 2024 in anticipation of the Federal Reserve’s first rate cut, influenced by the cooling job market and inflation moving towards the Fed’s 2 percent goal.