
As attendees from this year’s Annual Convention and Expo returned to their respective states, many messages are top of mind. One priority is supply and affordability.
Tag: MBA Chart of the Week

MBA Chart of the Week: Homeownership Rates
The Census Bureau recently released its 2023 American Community Survey one-year estimates.

MBA Chart of the Week: Share of Originations by Production Channel
The broker wholesale and non-delegated correspondent production channels accounted for a combined 20.5 percent of dollar volume originated in 2023 per MBA’s analyses of the Home Mortgage Disclosure Act (HMDA) data.

Chart of the Week: Payroll Growth and Unemployment Rate
The August employment report confirmed that the job market is cooling.
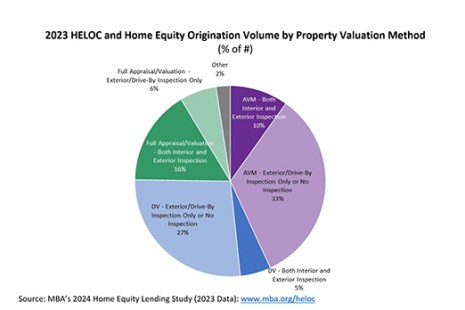
Chart of the Week: 2023 HELOC and Home Equity Origination Volume by Valuation Method
MBA recently completed its 2024 Home Equity Lending Study (covering 2023 data) tracking trends in origination and servicing operations for home equity lines of credit and home equity loans.
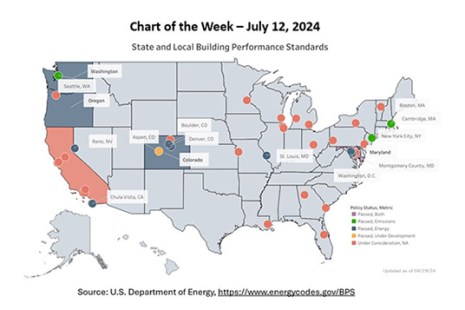
MBA Chart of the Week: State, Local Building Performance Standards
New York City has Local Law 97. Washington D.C. has its Building Energy Performance Standards (BEPS). Seattle has its Building Emissions Performance Standards (also BEPS). Denver has its Building Performance Policy (BPP).
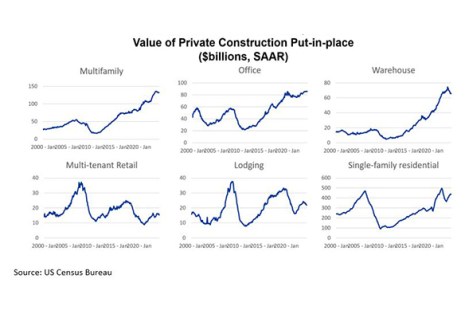
MBA Chart of the Week: Value of Private Construction Put-in-Place
Physicists have protons, neutrons, and electrons. Biologists have DNA and RNA. And economists have supply and demand — the building blocks upon which most of our understanding of markets rest.

Chart of the Week: Annual Cost of Servicing Performing and Non-Performing Loans
Based on the most recent completed study cycle, fully-loaded servicing costs remained flat relative to the previous year at an average of $237 per loan. But that only tells part of the story.

MBA Chart of the Week: Lender’s Loan Expense For Retail, Consumer Direct Channels
The longstanding MBA and STRATMOR Peer Group Roundtables Program recently wrapped up its Spring 2024 season for benchmarking lender performance across various production channels and peer groups.

MBA Chart of the Week: Seriously Delinquent Rates by Loan Type
According to the latest results from MBA’s National Delinquency Survey, the overall delinquency rate for mortgage loans on one‐to‐four‐unit residential properties increased slightly to a seasonally adjusted rate of 3.94 percent of all loans outstanding at the end of the first quarter of 2024.