MBA Chart of the Week: Selected Indexes of Housing Costs

(Sources: MBA, Zillow, U.S. Census Bureau, U.S. Bureau of Economic Analysis, Bureau of Labor Statistics; Courtesy of MBA)
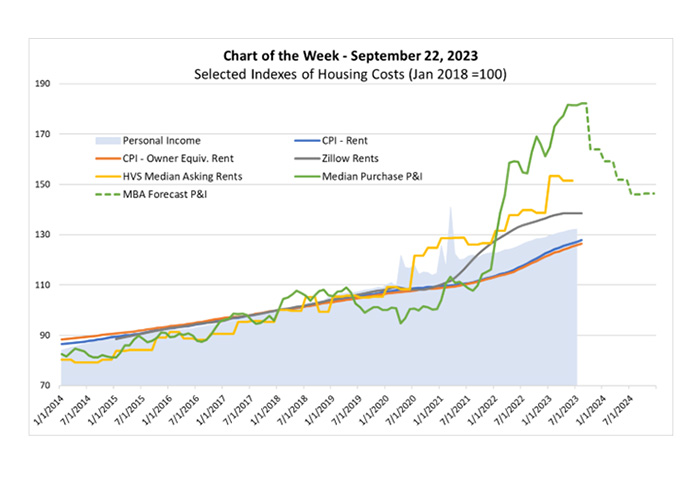
The monthly cost burden of purchasing a new home, as interest rates and house prices rose precipitously in 2022, continued in the first few months of 2023. For example, MBA’s Purchase Applications Payment Index (PAPI), hit a new high in May. Since then, despite 30-year mortgage interest rates eclipsing 7%, the index has come down slightly as median loan application amounts moderated. We are, however, still in record territory as shown by the solid green line in this week’s chart.
Before the pandemic, various gauges of housing costs moved more or less in unison. These included mortgage payments (green line), asking rents as depicted by Zillow (gray line) and the Census’ Housing Vacancy Survey (yellow line), and in-place rents, like those followed by the consumer price index for rents (blue line) and for owners’ equivalent rents (orange line).
The divergence of these measures during and following the pandemic raises the question of whether we should expect these housing cost measures to re-align, and if so, to what level and when.
The light blue shaded area in the chart–an index of personal income (PI) as measured by the Bureau of Economic Analysis–provides a clue as to where the realignment may occur. Regarding when we project median purchase principal and interest payments through 2024 using MBA forecasts of interest rates and the median price of existing home sales. Despite our forecast that interest rates will fall to 5.4% in the fourth quarter of 2024 and that median existing home sales will decrease from $429,700 in this quarter to $389,500 in the fourth quarter of 2024, it may not be until 2025 that the green dashed line retreats closer to the PI index.
Regarding rents, the asking rent measures in the chart started to turn in the second quarter. With approximately one million new multifamily units under construction and due to come available in the next two years, added supply will likely continue for the foreseeable future–putting continued downward pressure on asking rents while in-place rents continue to mark-to-market.
The housing market likely has many twists and turns in the coming quarters and years. The current turbulence in the different measures of housing costs points to the tumult the housing market has been experiencing–and potentially to greater stabilization ahead.
