Federal Reserve Chair Jay Powell testified before Congress last week and received several questions regarding recent inflation trends, with overall CPI inflation increasing 5.4 percent in June 2021 compared to a year ago. This followed readings of 4.2 percent in April and 5.0 percent in May. The headline inflation number was the highest in 13 years, while the recent monthly pace of core inflation is the highest since the early 1980s.
Tag: MBA Chart of the Week
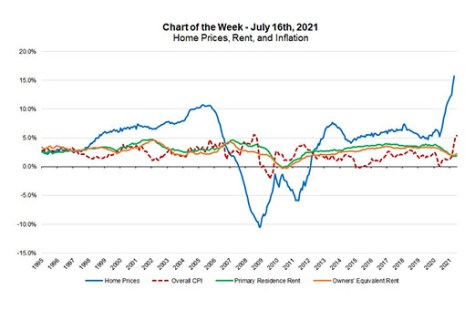
MBA Chart of the Week, July 19, 2021: Home Prices, Rent and Inflation
Federal Reserve Chair Jay Powell testified before Congress last week and received several questions regarding recent inflation trends, with overall CPI inflation increasing 5.4 percent in June 2021 compared to a year ago. This followed readings of 4.2 percent in April and 5.0 percent in May. The headline inflation number was the highest in 13 years, while the recent monthly pace of core inflation is the highest since the early 1980s.
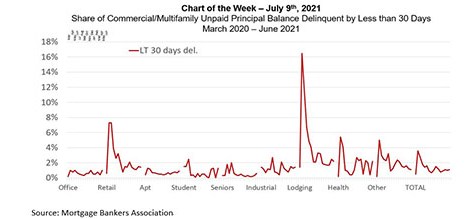
MBA Chart of the Week, July 9, 2021: Commercial/Multifamily Delinquencies
When looking at commercial and multifamily mortgage delinquency rates, we tend to exclude loans that have been delinquent for less than 30 days, as many may be experiencing a temporary “hiccup” that will be quickly remedied before the next payment is due. But examining these rates can provide key insights into commercial and multifamily mortgage performance through the pandemic and into today.
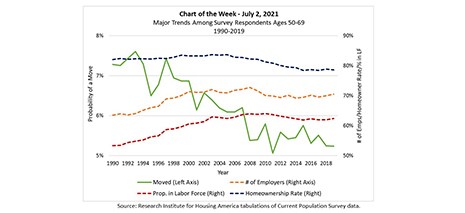
MBA Chart of the Week July 6 2021: Older Workers’ Labor Force Participation
The Research Institute for Housing America, MBA’s think tank, released a special report that examines why, since the 1990s, older workers’ labor force participation has increased while their migration has decreased, counter to conventional economic wisdom.
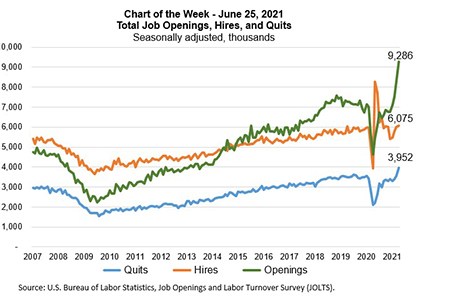
MBA Chart of the Week June 28 2021: Total Job Openings, Hires and Quits
In this week’s MBA Chart of the Week, we examine the monthly data series on job openings, hires and separations produced by the U.S. Bureau of Labor Statistics’ Job Openings and Labor Turnover Survey (JOLTS) program.
MBA Chart of the Week June 28 2021: Total Job Openings, Hires and Quits
In this week’s MBA Chart of the Week, we examine the monthly data series on job openings, hires and separations produced by the U.S. Bureau of Labor Statistics’ Job Openings and Labor Turnover Survey (JOLTS) program.
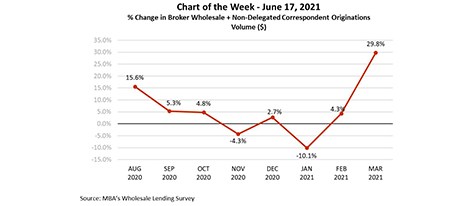
MBA Chart of the Week June 21, 2021: MBA Wholesale Lending Survey
In third quarter 2020, MBA launched a new Wholesale Lending Survey for members to track broker wholesale and non-delegated correspondent volume and related metrics. This week’s chart shows the percentage change from the previous month in average broker-wholesale and non-delegated correspondent volume.