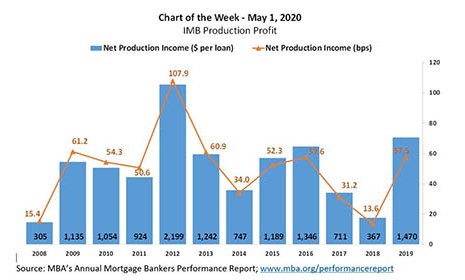
Independent mortgage banks and mortgage subsidiaries of chartered banks reported average pre-tax production profits of 58 basis points ($1,470 on each loan they originated) in 2019, up from 14 basis points ($367 per loan) in 2018, according to the MBA Annual Mortgage Bankers Performance Report, released last month.
Tag: MBA Chart of the Week
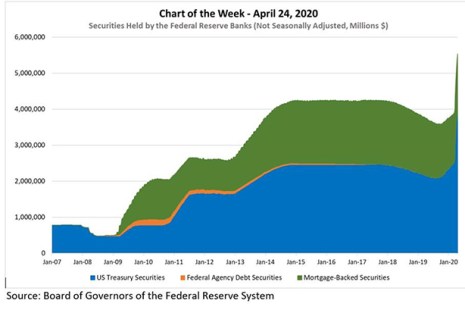
MBA Chart of the Week: Securities Held by Federal Reserve Banks
The MBA Chart of the Week shows the evolution of securities held outright by the Federal Reserve Banks since 2007.
MBA Chart of the Week: Securities Held by Federal Reserve Banks
The MBA Chart of the Week shows the evolution of securities held outright by the Federal Reserve Banks since 2007.
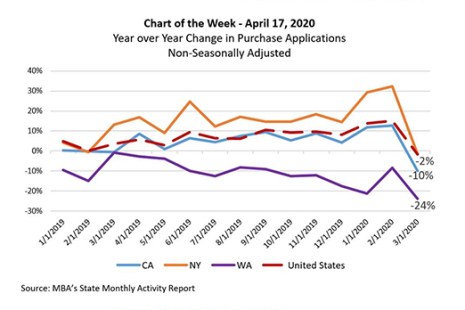
MBA Chart of the Week: Year over Year Change in Purchase Applications
According to data from MBA’s State Monthly Activity Report (SMAR), purchase applications grew for 14 consecutive months until the impacts of COVID-19 slowed activity to a 2 percent decline in March. Most of the decline was likely in the last two weeks of the month, when many states enacted restrictions on non-essential business and social activity.
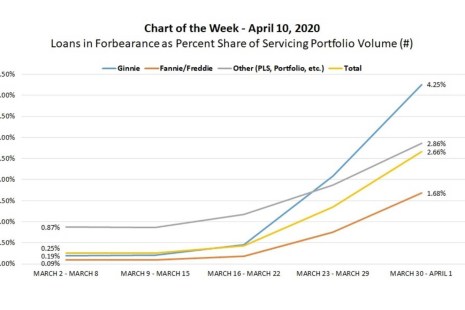
MBA Chart of the Week: Loans in Forbearance as Percent Share of Servicing Portfolios
New survey findings released by MBA this week highlight the unprecedented, widespread mortgage forbearance already requested by borrowers affected by the spread of the coronavirus (COVID-19).
MBA Chart of the Week: Loans in Forbearance as Percent Share of Servicing Portfolios
New survey findings released by MBA this week highlight the unprecedented, widespread mortgage forbearance already requested by borrowers affected by the spread of the coronavirus (COVID-19).
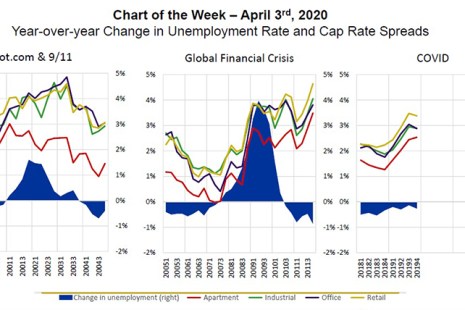
MBA Chart of the Week: Year-over-Year Change in Unemployment Rate and Cap Rate Spreads
For commercial real estate markets, a key factor in how we work through this period of uncertainty will be how investors value properties and their incomes. Our experiences in the past two recessions may provide some insights.
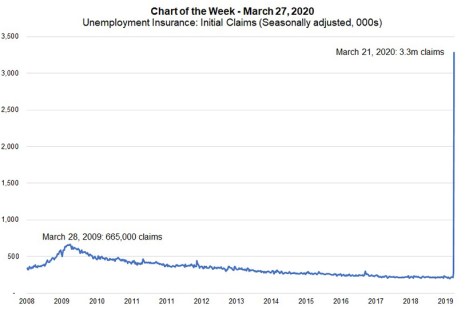
MBA Chart of the Week: Unemployment Insurance–Initial Claims
Last week provided our first indication of just how severe the shutdown of the U.S. economy could be, as Americans combat the ongoing spread of the coronavirus.