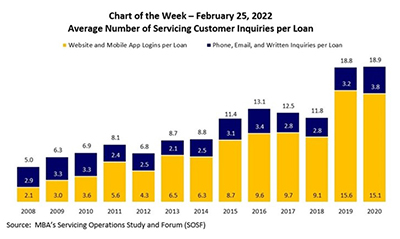
In this week’s MBA Chart of the Week, we focus on borrower communications, specifically the average number of annual servicing customer inquiries per loan. MBA has tracked this data through its Servicing Operations Study and Forum since 2008.
Tag: MBA Chart of the Week
MBA Chart of the Week: Warehouse Lines for First Mortgages
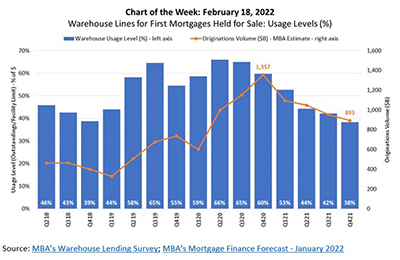
The average usage level of first-mortgage warehouse lines – the percentage of outstanding borrowings to warehouse facility limits – fell for the sixth consecutive quarter to 38% as of the end of the fourth quarter, according to MBA’s quarterly Warehouse Lending Survey.
MBA Chart of the Week: Warehouse Lines for First Mortgages
The average usage level of first-mortgage warehouse lines – the percentage of outstanding borrowings to warehouse facility limits – fell for the sixth consecutive quarter to 38% as of the end of the fourth quarter, according to MBA’s quarterly Warehouse Lending Survey.
MBA Chart of the Week Feb. 14 2022: Mortgage Delinquency Rates
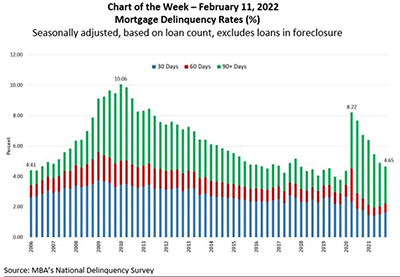
The Mortgage Bankers Association’s National Delinquency Survey – covering national and state delinquencies through the fourth quarter of 2021 – was released last week.
MBA Chart of the Week Feb. 14 2022: Mortgage Delinquency Rates
The Mortgage Bankers Association’s National Delinquency Survey – covering national and state delinquencies through the fourth quarter of 2021 – was released last week.
MBA Chart of the Week: Job Openings for Selected Industries
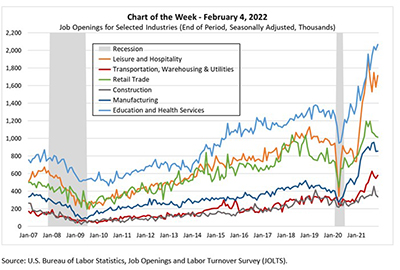
In this week’s MBA Chart of the Week, we updated the JOLTS monthly data series on job openings for selected industries.
MBA Chart of the Week Feb. 4 2022: Job Openings for Selected Industries
In this week’s MBA Chart of the Week, we updated the JOLTS monthly data series on job openings for selected industries.
MBA Chart of the Week Feb. 4 2022: Job Openings for Selected Industries
In this week’s MBA Chart of the Week, we updated the JOLTS monthly data series on job openings for selected industries.
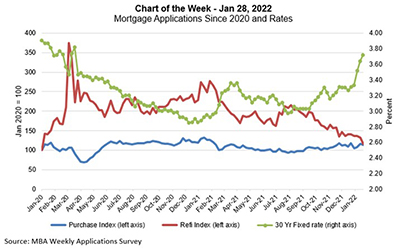
MBA Chart of the Week: Mortgage Applications, Rates Since 2020
This week’s MBA Chart of the Week features Weekly Applications Survey data, re-indexed to January 2020, to highlight the most recent refinance and home purchase trends.
MBA Chart of the Week: Mortgage Applications, Rates Since 2020
This week’s MBA Chart of the Week features Weekly Applications Survey data, re-indexed to January 2020, to highlight the most recent refinance and home purchase trends.