MBA Chart of the Week Dec. 23 2021: Percent of Current Loans

According to the MBA Monthly Loan Monitoring Survey, the share of loans in forbearance dropped to 1.67 percent of servicers’ portfolio volume as of November 30, after climbing to a monthly peak of 8.53 percent as of May 31, 2020. As many borrowers have moved out of forbearance and into permanent loan workout solutions since 2020, the question becomes: How are they faring?
This week’s MBA Chart of the Week shows the percentage of all serviced loans in our sample by product type that were current (not delinquent or in foreclosure) as of November 30, relative to loans that were in a completed workout from 2020 and onward. Completed workouts include repayment plans, loan deferrals/partial claims and loan modifications.
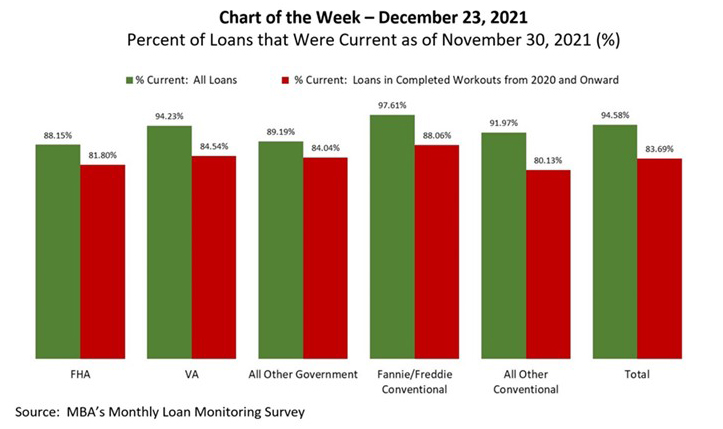
Total loans serviced that were current as a percent of servicing portfolio volume (#) rose to 94.58% as of November 30, from 94.32% as of October 31 on a non-seasonally adjusted basis. Total completed loan workouts from 2020 and onward that were current as a percent of total completed workouts declined to 83.69% as of the end of last month from 84.04% as of the end of October.
By product type as of November 30, Fannie Mae/Freddie Mac had the highest percentage of all loans that were current, as well as the highest percentage of loan workouts that were current. By contrast, FHA had the lowest percentage of all loans that were current, while All Other Conventional (non-government loans not sold to Fannie Mae or Freddie Mac) had the lowest percentage of loan workouts that were current.
We will continue to monitor the performance of servicing portfolio volume, as well as the performance of post-forbearance workouts, through this monthly survey, which replaces the Weekly Forbearance and Call Volume Survey.
- Marina Walsh, CMB (mwalsh@mba.org); Jon Penniman (jpenniman@mba.org)