According to the inaugural 2021 Diversity, Equity and Inclusion Study, conducted by McLagan and recommended by Mortgage Bankers Association, participating mortgage firms – both residential and commercial/multifamily – had varied policies, practices and initiatives to further racial and gender equality within their organizations.
Tag: MBA Chart of the Week
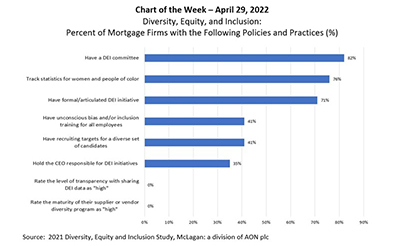
MBA Chart of the Week Apr. 29 2022: Diversity, Equity and Inclusion
According to the inaugural 2021 Diversity, Equity and Inclusion Study, conducted by McLagan and recommended by Mortgage Bankers Association, participating mortgage firms – both residential and commercial/multifamily – had varied policies, practices and initiatives to further racial and gender equality within their organizations.
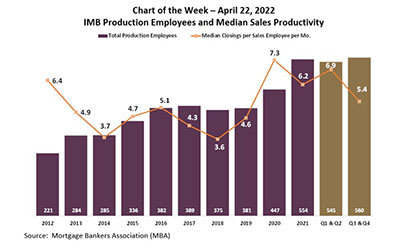
MBA Chart of the Week Apr. 22 2022: IMB Production
This week’s chart shows average production employees (sales, fulfillment and support staff for such functions as production technology, post-closing and secondary marketing) and median productivity of sales staff from 2012 through 2021.
MBA Chart of the Week Apr. 22 2022: IMB Production
This week’s chart shows average production employees (sales, fulfillment and support staff for such functions as production technology, post-closing and secondary marketing) and median productivity of sales staff from 2012 through 2021.
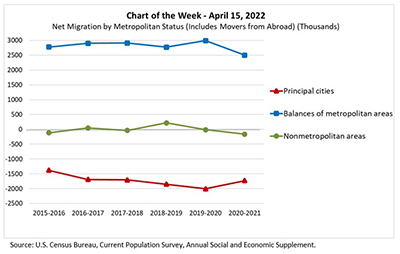
MBA Chart of the Week Apr. 15, 2022: Net Migration by Metropolitan Status
MBA Chart of the Week shows net migration by metropolitan status from spring 2015 to spring 2021. The most recent 2020-2021 data allows us to examine moves during the first year of the pandemic, and to see if, as widely reported, there was accelerated movement out of cities to the suburbs (or even further afield) compared to the five years prior to COVID-19.
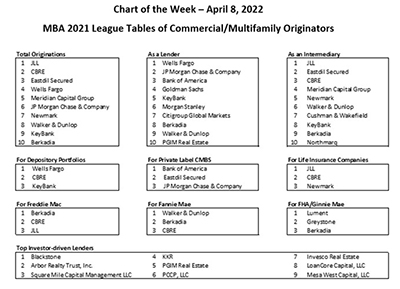
MBA Chart of the Week Apr. 8, 2022: Top Commercial/Multifamily Originators
MBA’s Commercial Real Estate/Multifamily Finance Firms – Annual Origination Volumes annual report presents a comprehensive set of listings of commercial/multifamily mortgage originators, their volumes and the different roles they play.
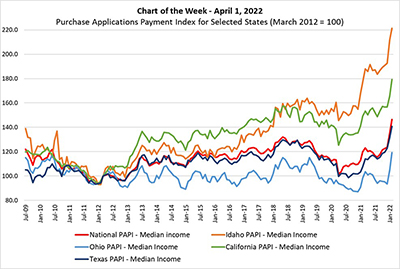
MBA Chart of the Week Apr. 1 2022: MBA Purchase Applications Payment Index
On March 24, MBA released its inaugural, monthly Purchase Applications Payment Index (PAPI) – an affordability index that measures how new fixed-rate 30-year purchase mortgage payments vary across time relative to income.