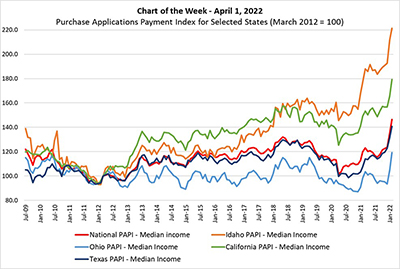
On March 24, MBA released its inaugural, monthly Purchase Applications Payment Index (PAPI) – an affordability index that measures how new fixed-rate 30-year purchase mortgage payments vary across time relative to income.
Tag: MBA Chart of the Week
MBA Chart of the Week Mar. 25 2022: IMB Net Production Income/Average Production Volume
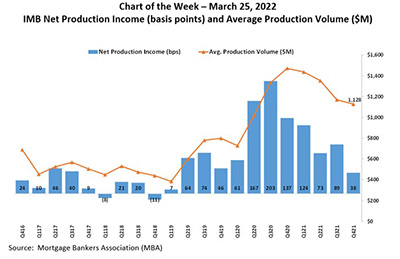
In this week’s MBA Chart of the Week, we show the average net production income from fourth-quarter 2016 through fourth-quarter 2021, along with the average production volume per company.
MBA Chart of the Week Mar. 25 2022: IMB Net Production Income/Average Production Volume
In this week’s MBA Chart of the Week, we show the average net production income from fourth-quarter 2016 through fourth-quarter 2021, along with the average production volume per company.
MBA Chart of the Week Mar. 18 2022: Consumer Inflation Expectations
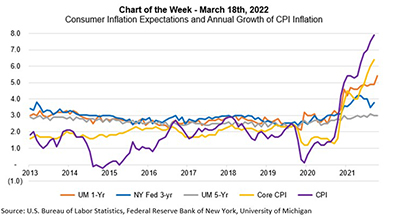
Inflation as measured by the Consumer Price Index reached an annual rate of nearly 8% in February. Over the past 12 months, inflation has increased steadily from less than 2% to 7.9%, compared to an average just under 2% in the five years prior.
MBA Chart of the Week Mar. 18 2022: Consumer Inflation Expectations
Inflation as measured by the Consumer Price Index reached an annual rate of nearly 8% in February. Over the past 12 months, inflation has increased steadily from less than 2% to 7.9%, compared to an average just under 2% in the five years prior.
MBA Chart of the Week Mar. 11, 2022: MBA Weekly Applications Survey Purchase Loan Size
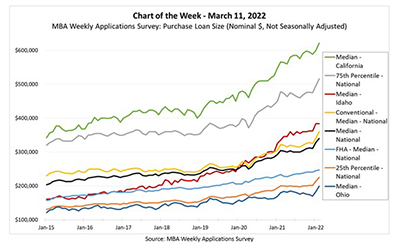
With increasing home prices, it is instructive to understand how home purchase mortgage origination amounts have increased. In this week’s MBA Chart of the Week, we examine how the loan size for fixed-rate 30-year purchase mortgage applications has changed since 2015 using MBA’s Weekly Applications Survey data.
MBA Chart of the Week Mar. 11, 2022: MBA Weekly Applications Survey Purchase Loan Size
With increasing home prices, it is instructive to understand how home purchase mortgage origination amounts have increased. In this week’s MBA Chart of the Week, we examine how the loan size for fixed-rate 30-year purchase mortgage applications has changed since 2015 using MBA’s Weekly Applications Survey data.
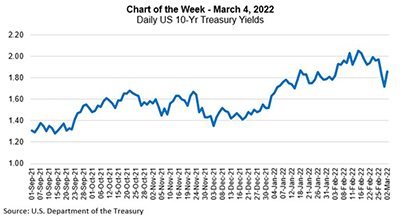
MBA Chart of the Week, Mar. 4, 2022: 10-Year U.S. Treasury Yields
Prior to Russia’s invasion, 10-Year Treasury yields broke higher — reaching 2.05% on February 15. Since then, they have fallen to as low as 1.72% but have rebounded somewhat, underscoring both the downside risk and volatility markets are facing.
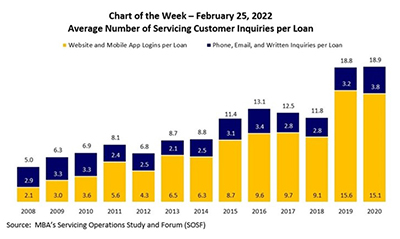
MBA Chart of the Week: Servicing Customer Inquiries Per Loan
In this week’s MBA Chart of the Week, we focus on borrower communications, specifically the average number of annual servicing customer inquiries per loan. MBA has tracked this data through its Servicing Operations Study and Forum since 2008.