MBA Chart of the Week, Dec. 3, 2021: U.S. Household Wealth
Source: MBA Research Institute for Housing America (RIHA) Calculations Based on 2016 and 2019 Surveys of Consumer Finance.
The Research Institute for Housing America, MBA’s think tank, released a special report, The Distribution of Wealth in America Since 2016.
The report, authored by ex-FHA Commissioner and HUD and OMB chief economist John Weicher, currently at the Hudson Institute, uses the two latest waves of the Federal Reserve Board’s triennial Survey of Consumer Finances to review the evolution of wealth among American households between 2016 and 2019. In addition, Weicher draws on available information—including COVID-19 economic effects and policy responses—to describe changes since 2019, and what they suggest about the distribution of wealth since then. The new report updates Weicher’s previous RIHA report, The Distribution of Wealth Since the Great Recession, that analyzed SCF data from 2007-2016.
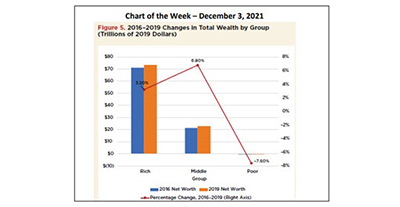
This week’s MBA Chart of the Week replicates Figure 5 from the new report. The figure shows that the net wealth of the rich, the top 10% of households, increased by 3.2% between 2016 and 2019, while the net worth of the poor, the bottom 30% of households, decreased by 7.6%. Poor households had $1.4 trillion in assets in 2019, but liabilities of $1.7 trillion. 14.9% of poor households were homeowners in 2019 (up from 14.5% in 2016), with 6% of these homeowners reporting they were underwater on their mortgages. Total home equity (for those reporting positive equity) was $120 billion (up from $48 billion in 2016).
The 60% middle households’ net worth increased by 6.8% between 2016 and 2019. After a decade of increasing inequality, three factors that drove the increase in middle-class wealth led to lower overall wealth inequality in 2019: The increase in homeownership, the steady rise in home values and the rising stock market.
The middle-wealth households’ homeownership rate increased from 83.2% to 84.7% between 2016 and 2019, and the total equity in their homes increased from $8.5 trillion to $9.6 trillion (13%). Weicher summarizes the change for the middle-class, explaining, “Since home equity was much the largest share of their wealth in both years, by any measure middle-wealth homeowners as a group benefitted from being homeowners during these three years.”
However, the 2019 SCF shows that average wealth among these middle-wealth households varied substantially by race and ethnicity. For example, Table 6 from the report (that was replicated in yesterday’s MBA press release) shows that White middle-class households had mean net worth of $322,000 whilst Black households had $193,000. Moreover, with respect to housing, the homeownership rate gap between White and Black middle-wealth households was 8.5%, the mean home value for White households was $215,000 versus $145,000 for Black households, and mean home equity was $149,000 for White households versus $115,000 for Black households.
Edward Seiler eseiler@mba.org.