MBA Chart of the Week Nov. 24, 2021: Price Changes in Turkeys, Cars, Shelter

As we celebrate the holidays, we examine recent trends in turkey prices and a few other noteworthy items. Inflation has been a dominant story of late, given the widespread disruption in supply chains and labor shortages resulting from the pandemic. Turkey prices are not spared from the rapid price increases experienced by many goods and services.
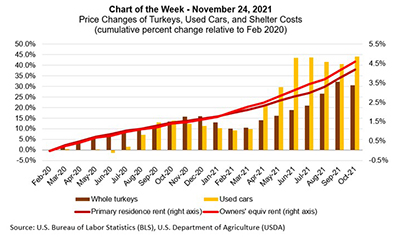
Based on data from the USDA, the average price of fresh or frozen whole turkeys increased 30.5% – from 106 cents per pound in February 2020 to 138 cents per pound in October. Lower turkey production, more expensive corn feed for turkeys, and higher transportation costs all likely contributed to these higher prices. Thanksgiving is traditionally also a time of increased travel for many households. Gasoline prices, as measured by the Consumer Price Index, were up over 25% over the same period. Used cars prices have skyrocketed 44% since the beginning of the pandemic, as air travel remains depressed, and shortages of new cars have driven up the value of used cars.
Last week’s MBA Chart of the Week highlighted how saturated our current housing stock is, as measured by vacancy rates. Home-price appreciation and rental rates also continue to climb. The CPI measures for primary residence rent and owners’ equivalent rent were 4.2% and 4.6% higher than the low point in February 2020, respectively. The annual changes for both series remained below their pre-pandemic levels, but the acceleration in home prices and rents will start to be picked up more significantly in the CPI series in the coming months, further adding to already high headline inflation. The CPI for October registered 6.2% annual growth, while the PCE price index released this morning showed 5.1% annual growth, both showing the highest rate of inflation since 1990.
- Joel Kan (jkan@mba.org)
