MBA Chart of the Week: Ownership & Rental Vacancy Rates
The U.S. housing stock is full.
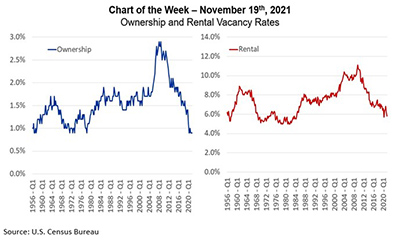
Each quarter the U.S. Census Bureau reports vacancy rates for homeownership and rental properties. Homeownership units are defined as those that are owner-occupied or are year-round units either sold and awaiting occupancy or currently for sale. Rental units are renter-occupied, or year-round units either rented and awaiting occupancy or available for rent.
On the homeownership side, at 0.9 percent, there has never been a smaller share of units vacant.
On the renter side, one would have to go back almost 40 years to the mid-1980s to match the 5.8 percent rental vacancy rate seen in the third quarter or the 5.7 percent of pre-pandemic Q2 2020.
New development activity has been trying to catch up – with 1.38 million units started in 2020, up from 1.29 million the year before, including more multifamily units currently under construction than at any time since the mid-1970s. But the vacancy numbers show supply is continuing to lose ground to demand. According to Census estimates, the number of vacant year-round homes in the United States fell from 13.2 million in third quarter 2019 to 11.7 million in Q3 2021 – a drop of 1.5 million units or 11%.
A host of measures track symptoms of the tight housing market, including the inventory of homes for sale, home prices, rent increases, apartment property values and more. The Census data on vacancy rates gives us a glimpse of the underlying condition.
- Jamie Woodwell (jwoodwell@mba.org)