MBA Chart of the Week Jan. 21 2022: Loans in Forbearance
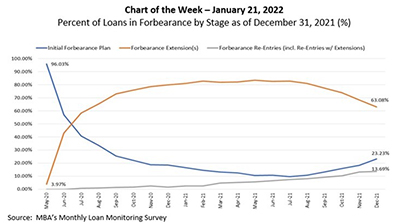
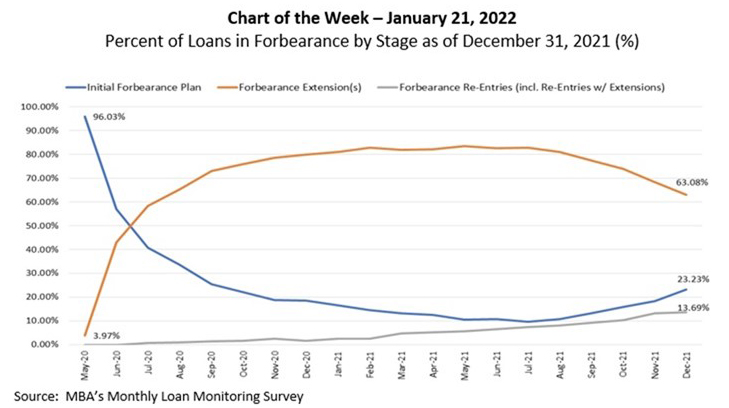
According to MBA’s latest Monthly Loan Monitoring Survey, the share of loans in forbearance dropped to 1.41 percent of servicers’ portfolio volume as of December 31, from 1.67 percent the prior month. MBA’s estimate is that there are now 705,000 homeowners in forbearance plans, down from the peak of almost 4.3 million homeowners in June 2020.
This week’s MBA Chart of the Week shows the percentage of all loans still in forbearance in our sample by stage: loans that are on the initial forbearance plan (usually 3 to 6 months), those loans in forbearance for which the forbearance period has been extended one or more times, and those loans that exited forbearance at one point then re-entered forbearance at a later point. Many borrowers with forbearance extensions reached the end of their maximum forbearance period over the course of the past four months and are now in more permanent loan workout solutions, thus the drop in the share of loans in forbearance with extensions.
Across the board, the gross number of loans in forbearance has dropped substantially over the past 18 months. It is likely that the remaining borrowers in forbearance have experienced either a permanent hardship that may require more complex loan workout solutions, or they have encountered a recent hardship for which they are now seeking relief.
We will continue to monitor the performance of servicing portfolio volume, as well as the performance of post-forbearance workouts, through this monthly survey, which replaces the Weekly Forbearance and Call Volume Survey.
The next publication of the Monthly Loan Monitoring Survey will be on Tuesday, February 22, at 4:00 p.m. ET.
- Marina Walsh, CMB (mwalsh@mba.org)