The pandemic did a number on the housing market.
Tag: Chart of the Week
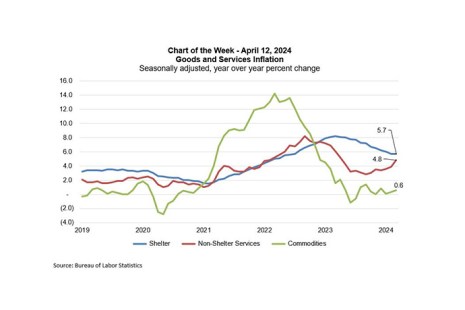
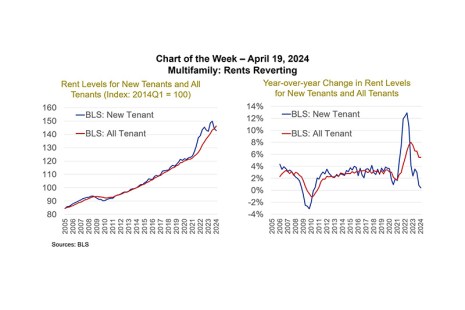
MBA Chart of the Week: Goods and Services Inflation
The week’s news has been around the Consumer Price Index (CPI) release showing that inflation was hotter than expected in March, which is likely to delay the Federal Reserve’s first rate cut in 2024 and contributed to a significant spike in the 10-year Treasury yield to over 4.5%.
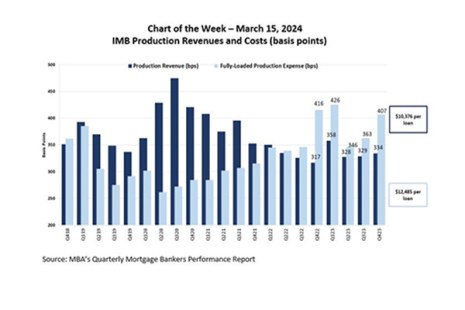
MBA Chart of the Week: IMB Production Revenues and Costs
MBA recently released its latest Quarterly Performance Report for the fourth quarter of 2023. The total sample of 342 independent mortgage banks and mortgage subsidiaries of chartered banks reported per-tax net production losses of 73 basis points (or $2,109) on each loan they originated. This marks the seventh consecutive quarter of net production losses.
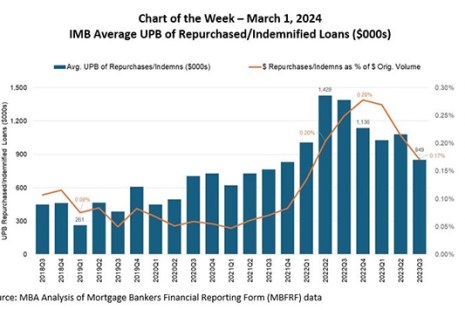
MBA Chart of the Week: IMB Average UPB of Repurchased/Indemnified Loans
MBA Research recently analyzed repurchase and indemnification volume over a five-year period from the third quarter of 2018 through the third quarter of 2023.
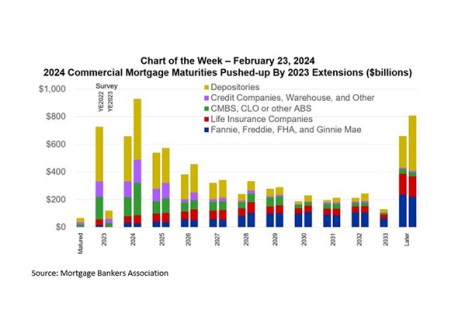
MBA Chart of the Week: 2024 Commercial Mortgage Maturities Pushed Up by 2023 Extensions
Commercial mortgages tend to be relatively long-lived, spreading maturities out over several years.
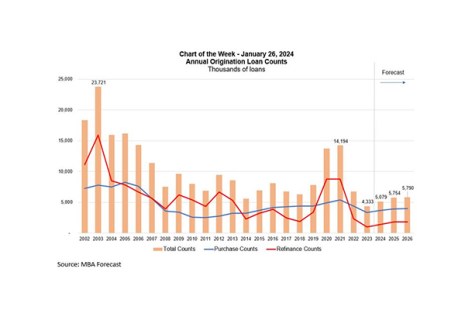
MBA Chart of the Week: Annual Origination Loan Counts
MBA’s January 2024 forecast calls for mortgage origination dollar volume to increase 23% in 2024 to $2 trillion, with a 16% increase in purchase and a 50% increase in refinance volume (off an extremely low base in 2023). For mortgage lenders of all types and sizes, as well as other industry players, it is also important to have an estimate of how many origination units are expected.
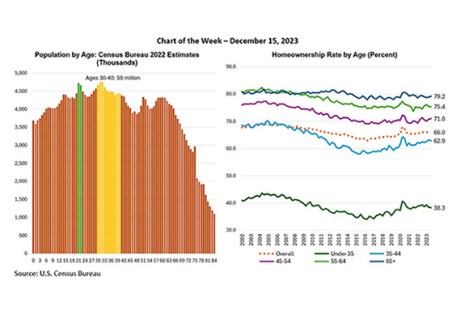
MBA Chart of the Week: Demographics of Potential First-Time Homebuyers
One of the main drivers for optimism is the country’s demographics. In this week’s MBA Chart of the Week, we highlight this by looking at the large cohorts of potential first-time homebuyers.
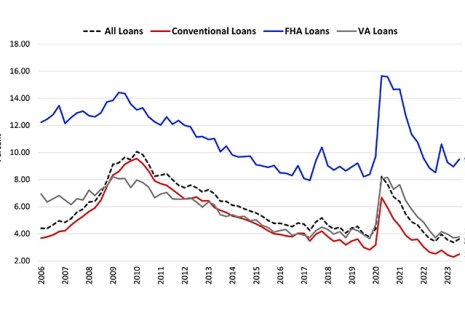
MBA Chart of the Week: Delinquency Rates by Loan Type, Conventional, FHA, VA
According to the latest MBA National Delinquency Survey, the overall delinquency rate for mortgage loans on one‐to‐four‐unit residential properties increased to 3.62% of all loans outstanding at the end of the third quarter of 2023.
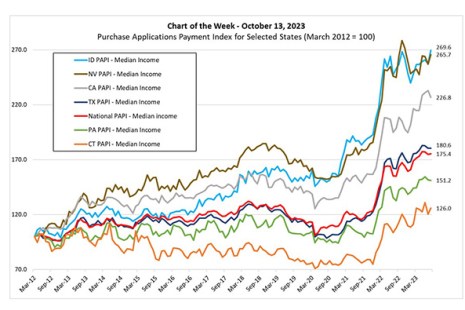
MBA Chart of the Week: Purchase Applications Payment Index for Selected States
The monthly cost burden of purchasing a new home, as interest rates and house prices rose precipitously in 2022, has continued into 2023. Indeed, the most recent Weekly Applications Survey release noted that the 30-year fixed mortgage rate is at 7.67% – the highest level since 2000, and the Federal Housing Finance Agency’s House Price Index shows that house prices continue to appreciate even as interest rates have eclipsed 7%.
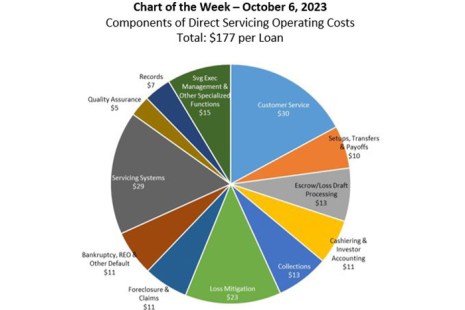
MBA Chart of the Week Oct. 9: MBA’s Servicing Operations Study and Forum
MBA’s annual Servicing Operations Study and Forum (SOSF) includes a deep-dive analysis and discussion of servicing costs, productivity, portfolio characteristics, and operational metrics for in‐house single-family servicers.