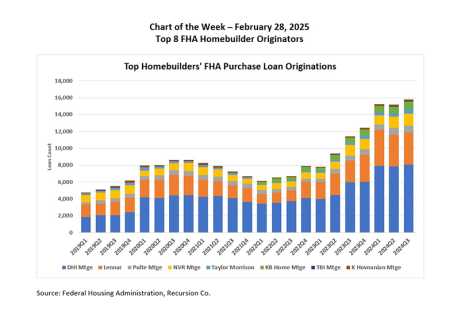
The headwinds facing mortgage transactions continued unabated in 2024 as home prices reached new record highs while the 30-year mortgage rate rose back over 7%. One sector that effectively dealt with these impediments was the homebuilders.
Tag: Chart of the Week
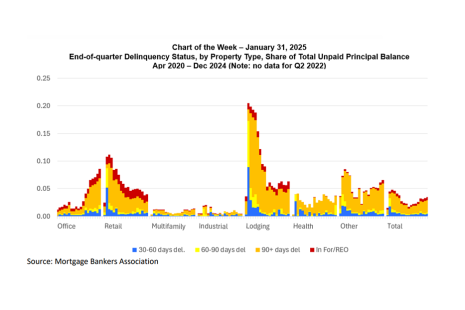
Chart of the Week: End-of-Quarter Delinquency Status, by Property Type, Share of Total Unpaid Principal Balance
Delinquency rates for commercial property mortgages increased in the fourth quarter, according to MBA’s latest CREF Loan Performance Survey.
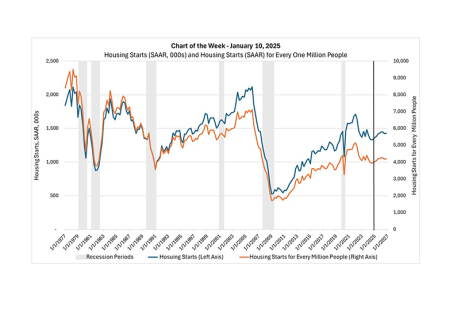
Chart of the Week: Housing Starts and Housing Starts for Every 1 Million People
In this week’s MBA Chart of the Week, we look at one statistic–aggregate single-family and multifamily housing starts–and examine how it has evolved since the start of the Carter Administration.

Chart of the Week: FHFA Purchase-Only House Price Index
Annualized home price growth in the U.S. peaked between the second half of 2021 and first half of 2022 before decelerating through most of 2023 as rising mortgage rates and tight inventory contributed to a pullback in demand.

MBA Chart of the Week: Third-Quarter Pre-Tax Net Production Income by Percentile
Independent mortgage banks and mortgage subsidiaries of chartered banks reported a simple average pre-tax net profit of 18 basis points, or $701 on each loan they originated in the third quarter, according to MBA’s Quarterly Mortgage Bankers Performance Report.
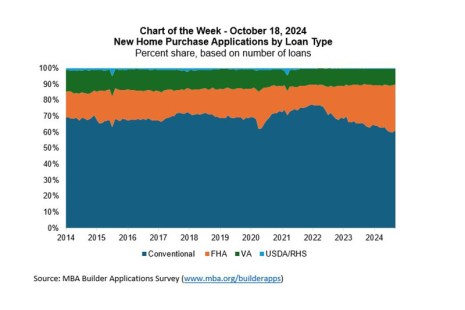
MBA Chart of the Week: New Home Purchase Applications by Loan Type
Mortgage applications to buy newly built homes have been seeing year-over-year growth since 2023, and in the MBA Builder Applications Survey results for September 2024, purchase applications were up 11% on an annual basis.

MBA Chart of the Week: Purchase Applications Index
In the wake of stronger economic data, including reports on jobs and inflation, mortgage rates have moved higher, with the 30-year fixed rate rising to 6.36%– the highest since August, based on the most recent data from the MBA’s Weekly Applications Survey.
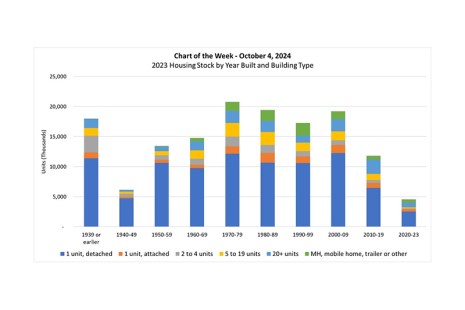
MBA Chart of the Week: 2023 Housing Stock by Year Built and Building Type
In this week’s MBA Chart of the Week, we show the stock of homes in the U.S. by the decade built and by building type.
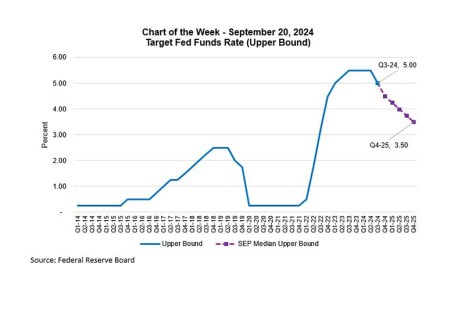
MBA Chart of the Week: Target Fed Funds Rate
The FOMC lowered the target Fed Funds rate by 50 basis points at its September meeting and signaled that this is the first cut in a series that is expected to bring the Fed Funds rate down by about 2 percentage points by the end of 2025.

MBA Chart of the Week: 2023 HMDA Respondents
A total of 4,874 companies reported lending activity under the Home Mortgage Disclosure Act (HMDA) in 2023, according to MBA’s analyses of the dataset.