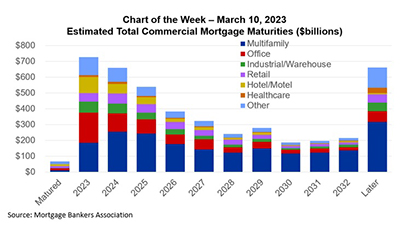
At MBA’s CREF Convention in San Diego last month, we released the results of our annual survey of upcoming commercial and multifamily mortgage maturities. The survey collects information directly from loan servicers on when the loans they service mature.
Tag: MBA Chart of the Week
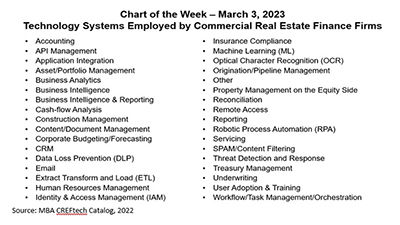
MBA Chart of the Week March 3 2023–Tech Systems Employed by Commercial Real Estate Finance Firms
This week’s Chart of the Week presents findings from MBA’s CREF Technology Catalog, showing the areas in which firms are applying specific tech solutions. What is clear in looking at the industry is that CREF has always relied heavily on technology and does so more and more each year.
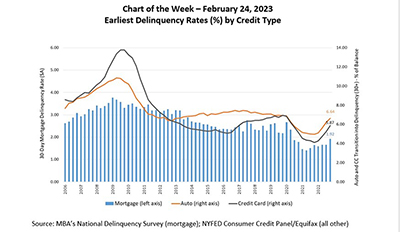
MBA Chart of the Week Feb. 24 2023–Delinquency Rates by Credit Type
The latest credit delinquency data from both MBA and other sources indicates that delinquencies are rising. In MBA’s National Delinquency Survey, covering national and state delinquencies through the fourth quarter of 2022 revealed that the delinquency rate for mortgage loans on one‐to‐four‐unit residential properties rose to a seasonally adjusted rate of 4.96 percent of all loans outstanding at the end of the fourth quarter.
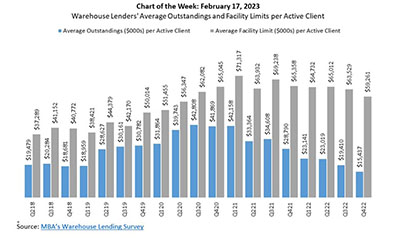
MBA Chart of the Week Feb. 17, 2023: Warehouse Lending
According to MBA’s latest Warehouse Lending Survey, warehouse lenders – as of the end of fourth-quarter 2022 – reported an average outstanding balance of $15.4 million per active client on their warehouse lines for first mortgages held for sale. This marks the fifth consecutive quarterly decline in per-client outstandings
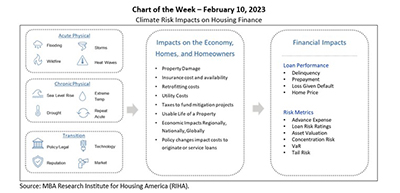
MBA Chart of the Week Feb. 10 2023: Climate Risk and Housing Finance
The Research Institute for Housing America, MBA’s think tank, released the first volume of A Collection of Essays on Climate Risk and the Housing Market that examines various aspects of how climate risk is impacting housing markets (as summarized in this week’s chart that replicates Exhibit 1 from the second essay).
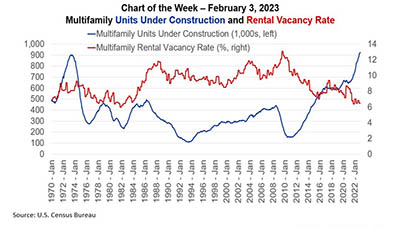
MBA Chart of the Week Feb. 3, 2023: Multifamily Construction/Vacancies
At the end of this week, many of us will begin our annual migration to San Diego and to MBA’s Commercial/Multifamily Finance Convention & Expo (CREF23). There will be no lack of topics to discuss – from return to the office, to the return of retail, and interest in cap rates to interest rate caps.