Two questions have dominated the CRE headlines of late: a) the reliance of banks on commercial real estate and b) the reliance of commercial real estate on banks. We addressed the former in a previous Chart of the Week.
Tag: MBA Chart of the Week
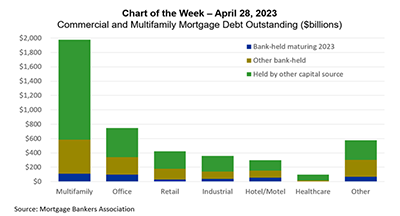
MBA Chart of the Week Apr. 28, 2023: Commercial/Multifamily Mortgage Debt Outstanding
Two questions have dominated the CRE headlines of late: a) the reliance of banks on commercial real estate and b) the reliance of commercial real estate on banks. We addressed the former in a previous Chart of the Week.
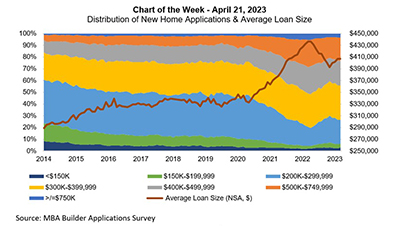
MBA Chart of the Week Apr. 21, 2023–New Home Applications, Average Loan Size
This week’s MBA Chart of the Week delves into builder applications by loan size, to illustrate how the mix of the new home market has changed since 2014.
MBA Chart of the Week Apr. 21, 2023–New Home Applications, Average Loan Size
This week’s MBA Chart of the Week delves into builder applications by loan size, to illustrate how the mix of the new home market has changed since 2014.
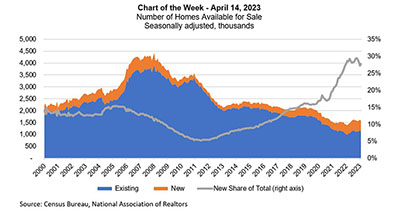
MBA Chart of the Week, Apr. 14, 2023: Number of Homes Available for Sale
MBA’s forecast calls for a gradual recovery in home purchase activity in the second half of 2023, driven by some catch-up buying from 2022 when mortgage rates surged and by younger age cohorts entering homeownership. However, this recovery will be dependent on affordability conditions improving
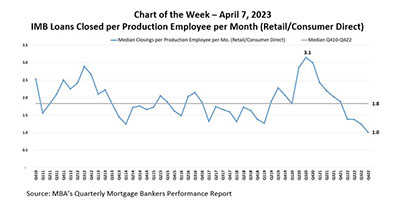
MBA Chart of Week Apr. 7, 2023: IMB Loans Closed Per Production Employee Per Month
In this week’s MBA Chart of the Week, we look at the median productivity of production employees for these independent mortgage bankers, given this drop in production volume.
MBA Chart of Week Apr. 7, 2023: IMB Loans Closed Per Production Employee Per Month
In this week’s MBA Chart of the Week, we look at the median productivity of production employees for these independent mortgage bankers, given this drop in production volume.
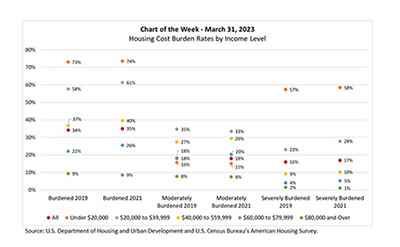
MBA Chart of the Week Mar. 31, 2023: Housing Cost Burden Rates by Income Level
In this week’s MBA Chart of the Week, we look at housing cost ratios by household income level, using data from the 2021 American Housing Survey.
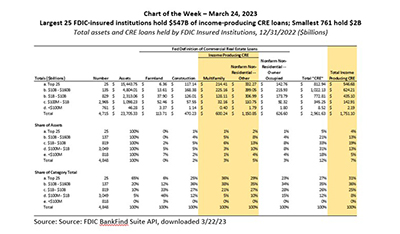
MBA Chart of the Week, Mar. 24, 2023: CRE Loans/FDIC-Insured Institutions
There is, not inappropriately, a great deal of attention being paid to commercial real estate right now. And with that attention come a lot of different questions and answers—with many answers varying depending on how one defines things.