In Thursday’s MBA Purchase Applications Payment Index (PAPI) release, MBA Research introduced a new measure—The Builders’ Purchase Applications Payment Index (BPAPI).
Tag: MBA Chart of the Week
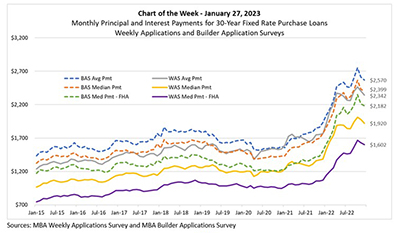
MBA Chart of the Week, Jan. 27, 2023: Monthly Principal, Interest Payments
In Thursday’s MBA Purchase Applications Payment Index (PAPI) release, MBA Research introduced a new measure—The Builders’ Purchase Applications Payment Index (BPAPI).
MBA Chart of the Week Jan. 20 2023: New Residential Construction/Home Purchases
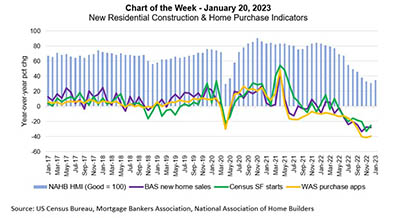
This week’s MBA Chart of the Week captures data on new residential construction market and the state of new single-family home sales.
MBA Chart of the Week Jan. 20 2023: New Residential Construction/Home Purchases
This week’s MBA Chart of the Week captures data on new residential construction market and the state of new single-family home sales.
MBA Chart of the Week Jan. 13, 2023: Mortgage-Treasury Spread
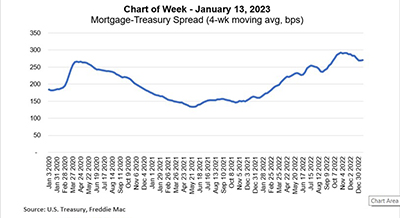
This week’s MBA Chart of the Week looks at the spread of mortgage rates relative to Treasury yields. This has been one of the more puzzling aspects of the current environment and a contributor to the rapid rise in mortgage rates over the past year.
MBA Chart of the Week Jan. 13, 2023: Mortgage-Treasury Spread
This week’s MBA Chart of the Week looks at the spread of mortgage rates relative to Treasury yields. This has been one of the more puzzling aspects of the current environment and a contributor to the rapid rise in mortgage rates over the past year.
MBA Chart of the Week Jan. 6, 2023: CRE Lending/Borrowing
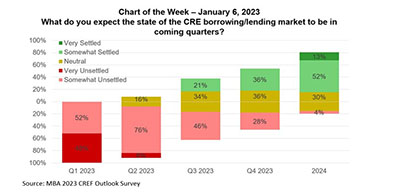
Commercial real estate markets are entering 2023 amid a great deal of uncertainty and, as a result, a significant slowdown in activity. Leaders of top commercial real estate finance firms believe that overall uncertainty will dissipate over the course of the year, but with a host of factors that will drag – rather than boost – the markets in 2023.
MBA Chart of the Week Jan. 6, 2023: CRE Lending/Borrowing
Commercial real estate markets are entering 2023 amid a great deal of uncertainty and, as a result, a significant slowdown in activity. Leaders of top commercial real estate finance firms believe that overall uncertainty will dissipate over the course of the year, but with a host of factors that will drag – rather than boost – the markets in 2023.
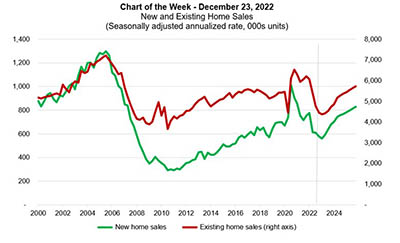
MBA Chart of the Week: New, Existing Home Sales
We are forecasting a weak start to 2023 for the housing market. Driven by a recession in the first half of the year and a continuation of the trends outlined above, we expect a 13% drop in existing home sales and a 4% decrease in new home sales for 2023, following 16% decreases in both segments in 2022.