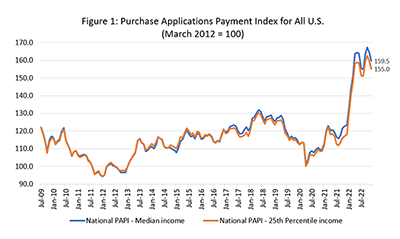
Homebuyer affordability improved in December, with the national median payment applied for by purchase applicants decreasing 2.9 percent to $1,920 from $1,977 in November, the Mortgage Bankers Association reported.
Tag: Edward Seiler
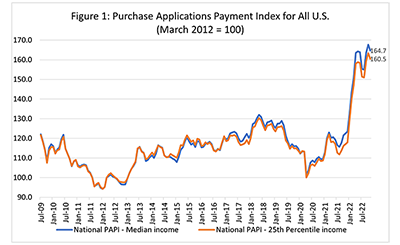
November Mortgage Application Payments Fall 1.8% to $1,977
Homebuyer affordability improved in November, with the national median payment applied for by mortgage applicants decreasing 1.8 percent to $1,977 from $2,012 in October, according to the Mortgage Bankers Association’s Purchase Applications Payment Index.
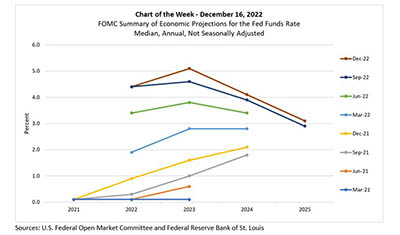
MBA Chart of the Week Dec. 16, 2022: Federal Funds Rate Projections
In an effort to increase transparency after the Great Recession, one of the Federal Open Market Committee communication initiatives under Chairman Ben Bernanke was to publish individual members’ assessments of the economy in the Summary of Economic Projections. In this week’s MBA Chart of the Week, we track changes in policymakers’ quarterly published SEP forecasts of the federal funds rate over the past eight quarters.
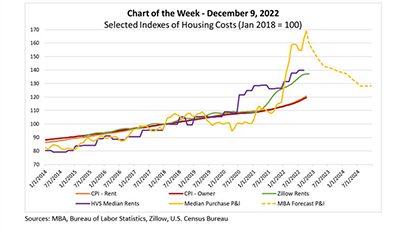
MBA Chart of the Week, Dec. 9, 2022: Housing Cost Indices
Housing costs are – appropriately – getting a lot of attention. Part of that attention stems from affordability challenges heightened by recent rapid increases in home prices, interest rates and rents. Another part stems from the fact that shelter costs are such a significant driver of measures of inflation, and thus a key motivator of Federal Reserve policies. In this week’s Chart of the Week, we examine selected indices of housing costs.
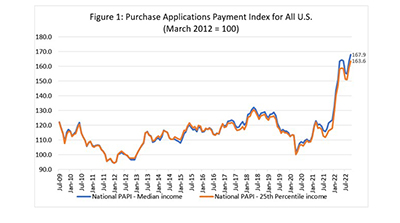
October Mortgage Application Payments Rise 3.7 Percent to $2,012
Homebuyer affordability continued its downward trajectory in October, as the national median payment applied for by applicants increased 3.7 percent to $2,012 from $1,941 in September, according to the Mortgage Bankers Association’s Purchase Applications Payment Index.
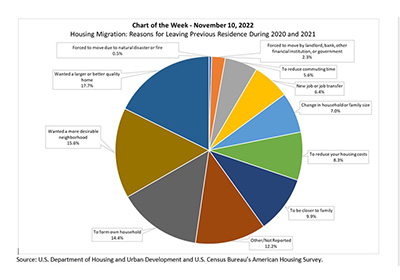
MBA Chart of the Week Nov. 10 2022: Housing Migration
This week’s MBA Chart of the Week shows the reasons for leaving one’s previous residence. The three main reasons in the 2021 AHS are wanting a larger or better-quality home (17.7%), wanting a more desirable neighborhood (15.6%) and forming their own household (14.4%).

