Homebuyer affordability declined in August with the national median payment applied for by purchase applicants increasing to $2,170 from 2,162 in July according to the Mortgage Bankers Association’s Purchase Applications Payment Index.
Tag: Edward Seiler
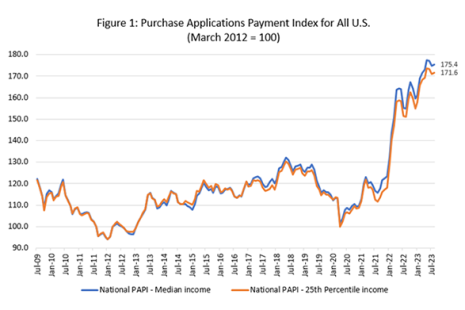
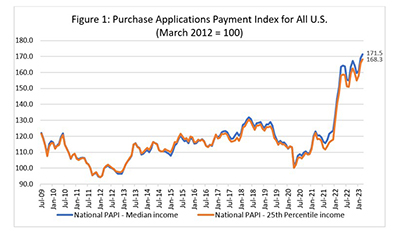
MBA: Mortgage Application Payments Increased Slightly to $2,170 in August
Homebuyer affordability declined in August with the national median payment applied for by purchase applicants increasing to $2,170 from 2,162 in July according to the Mortgage Bankers Association’s Purchase Applications Payment Index.
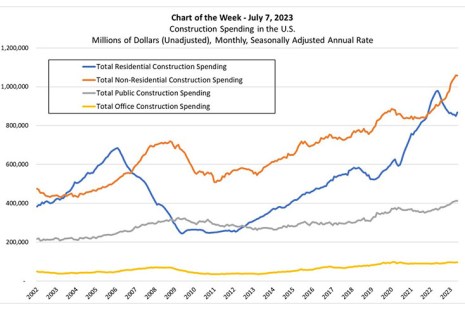
MBA Chart of the Week July 10, 2023
The U.S. Census Bureau released updated construction spending survey data. Also referred to as the Value of Construction Put in Place, the survey covers all private residential construction and improvements, non-residential construction, and public construction.
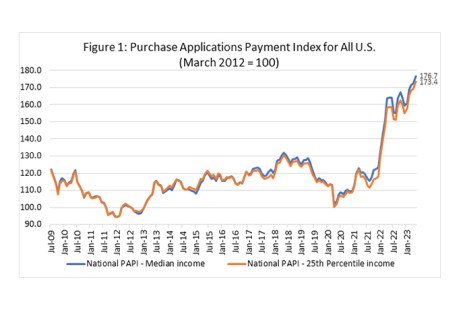
MBA: Mortgage Application Payments Increase 2.5% to $2,165 in May
Homebuyer affordability declined further in May, with the national median payment applied for by purchase applicants increasing 2.5% to $2,165 from $2,112 in April, the Mortgage Bankers Association reported.
MBA: Mortgage Application Payments Increased 0.9% to $2,112 in April
Homebuyer affordability declined further in April, with the national median payment applied for by purchase applicants increasing 0.9 percent to $2,112, the Mortgage Bankers Association’s Purchase Applications Payment Index reported.
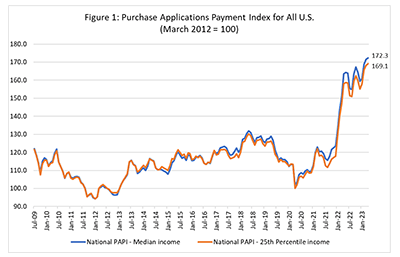
MBA: March Mortgage Application Payments Increase 1.6 Percent to Record High
Homebuyer affordability declined in March, with the national median payment applied for by purchase applicants increasing 1.6 percent to $2,093 from $2,061 in February, the Mortgage Bankers Association reported Thursday.
MBA: March Mortgage Application Payments Increase 1.6 Percent to Record High
Homebuyer affordability declined in March, with the national median payment applied for by purchase applicants increasing 1.6 percent to $2,093 from $2,061 in February, the Mortgage Bankers Association reported Thursday.
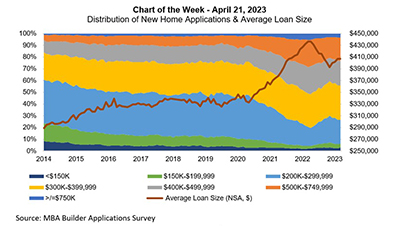
MBA Chart of the Week Apr. 21, 2023–New Home Applications, Average Loan Size
This week’s MBA Chart of the Week delves into builder applications by loan size, to illustrate how the mix of the new home market has changed since 2014.
MBA Chart of the Week Apr. 21, 2023–New Home Applications, Average Loan Size
This week’s MBA Chart of the Week delves into builder applications by loan size, to illustrate how the mix of the new home market has changed since 2014.
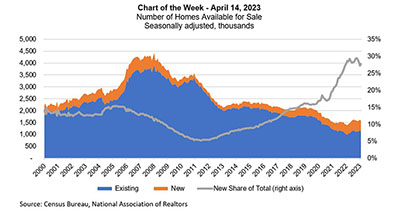
MBA Chart of the Week, Apr. 14, 2023: Number of Homes Available for Sale
MBA’s forecast calls for a gradual recovery in home purchase activity in the second half of 2023, driven by some catch-up buying from 2022 when mortgage rates surged and by younger age cohorts entering homeownership. However, this recovery will be dependent on affordability conditions improving