MBA Chart of the Week Nov. 4 2022: Mortgage Payment to Rent Ratio
Last week, MBA released its September Purchase Applications Payment Index data, which revealed that homebuyer affordability took a large hit in September, with the 75-basis-point jump in mortgage rates leading to the typical homebuyer’s monthly payment rising $102 to $1,941—further reducing the purchasing power of potential homebuyers.
The median monthly payment has increased $558, or 40.4% since the beginning of the year. PAPI, a measure of median application mortgage payment to median income, increased 5.5% to 163.6 in September from 155.0 in August reversing four consecutive months of declines from a high of 164.2 in May . The September PAPI data are indicative of declining borrower affordability conditions, even as earnings continue to rise, that may well continue into October as interest rates eclipsed 7%.
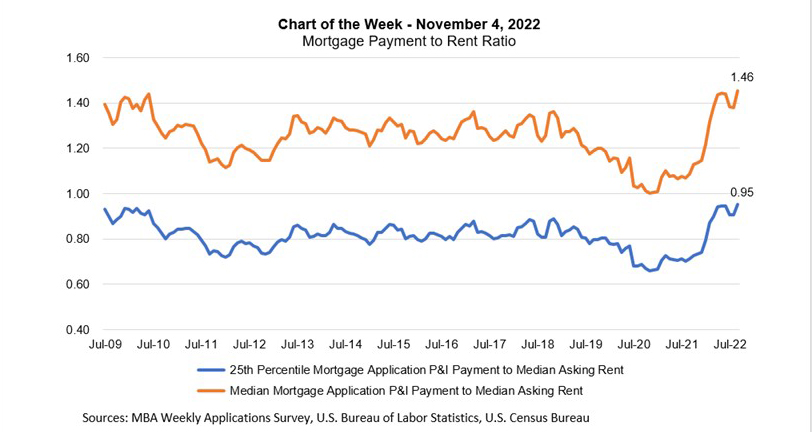
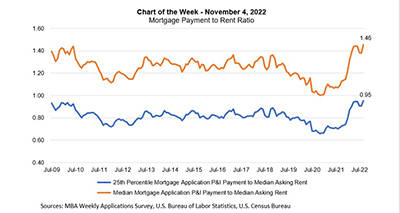
This week’s MBA Chart of the Week examines another metric from our PAPI dataset – the mortgage payment to rent ratio. The orange line relates the median principal and interest payment to the median asking rent, and the blue line relates the 25th percentile mortgage application payment to the median asking rent (that may be a more suitable ratio for first-time homebuyers).
The ratio was 1.46 in September, the highest that it has been dating back to the beginning of the series in 2009. The national median asking rent has increased from around $1,000 at the end of 2019 to $1,334 in September 2022. The doubling in mortgage rates over the past year has kept the mortgage payment more expensive relative to a rent payment. However, at the 25th percentile for monthly mortgage payments, the ratio is still below a value of 1. This means that even with the recent increase in mortgage payments, the 25th percentile mortgage payment remains below the median rent payment.
The cost of housing is of fundamental importance, but also as it pertains to inflation. Housing affordability has come into more intense focus of late as both owner and renter vacancy rates have remained close to record lows, driving up both home prices and rents. Inflation is still close to 40-year highs, and shelter costs growing at more than double their historical annual growth rates account for a large portion of inflation growth. The impact of higher shelter costs has yet to peak in most inflation measures and will continue to add to the challenges faced by the Federal Reserve as they bring down inflation.
Additionally, we covered other perspectives of rent growth measures and inflation in our September 9 and October 14 editions of Chart of the Week. Please visit mba.org/research to access our Chart of the Week archive.
–Joel Kan jkan@mba.org; Edward Seiler eseiler@mba.org.