MBA: March Mortgage Application Payments Increase 1.6 Percent to Record High
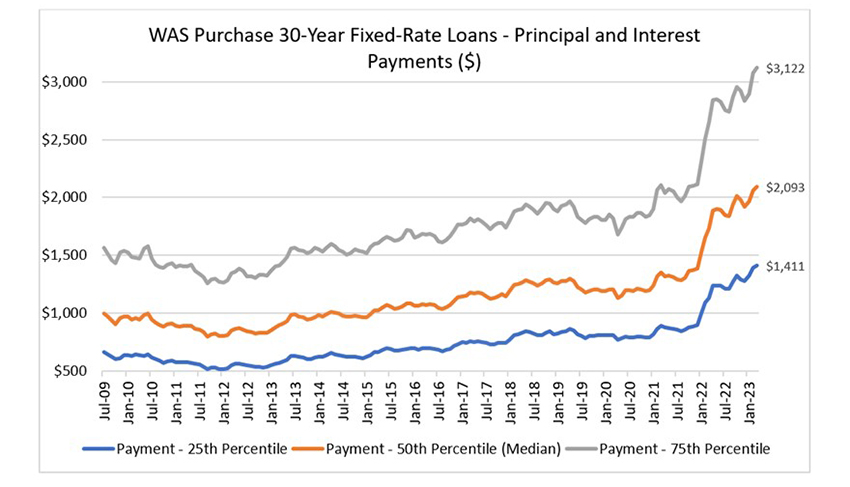
Homebuyer affordability declined in March, with the national median payment applied for by purchase applicants increasing 1.6 percent to $2,093 from $2,061 in February, the Mortgage Bankers Association reported Thursday.
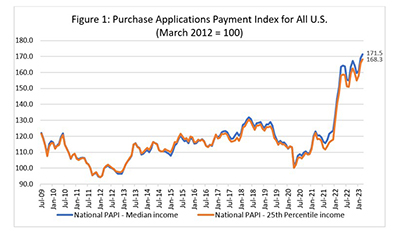
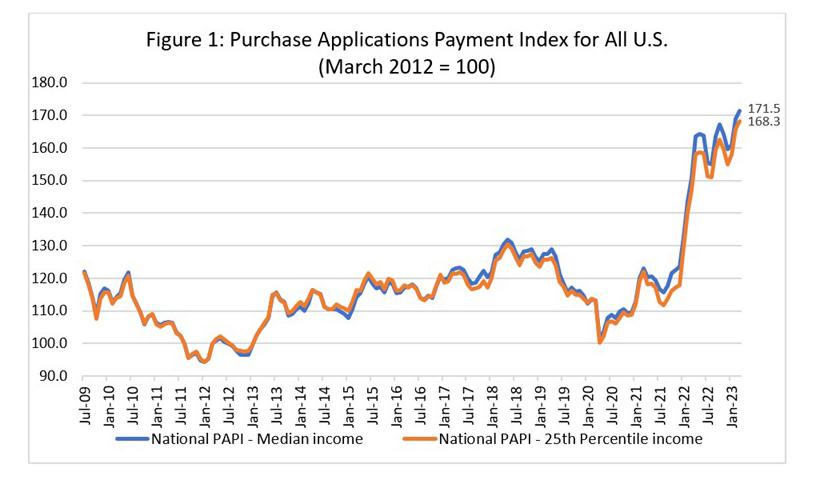
The MBA Purchase Applications Payment Index, known as PAPI, increased by 1.6 percent to a record-high 171.5 in March from 168.9 in February (figure 1). From a year ago (147.1), the index rose by 13.7 percent. For borrowers applying for lower-payment mortgages (the 25th percentile), the national mortgage payment increased to $1,411 in March from $1,391 in February.
The MBA Builders’ Purchase Application Payment Index (BPAPI) showed the median mortgage payment for purchase mortgages from the MBA Builder Application Survey increased to $2,508 in March from $2,492 in February.
“Homebuyer affordability remained constrained in March as elevated mortgage rates and low inventory kept prices high, leading many prospective homebuyers to delay decisions to enter the market,” said Edward Seiler, MBA Associate Vice President for Housing Economics, and Executive Director of the MBA Research Institute for Housing America. “The affordability index hit a new survey high last month, with both the typical purchase application amount and monthly payment rising on a monthly and annual basis. While many prospective buyers currently remain on the sidelines, MBA expects mortgage rates to decline slowly as the year progresses, which will help with affordability and may spur sales activity.”
Additional Key Findings from the March PAPI:
• The national median mortgage payment rose to $2,093 in March, up from $2,061 in February and from $1,964 in January. It is up $357 from one year ago, equal to a 20.6% increase.
• The national median mortgage payment for FHA loan applicants rose to $1,755 in March, up from $1,707 in February and from $1,254 in March 2022.
• The national median mortgage payment for conventional loan applicants rose to $2,145, up from $2,117 in February and from $1,819 in March 2022.
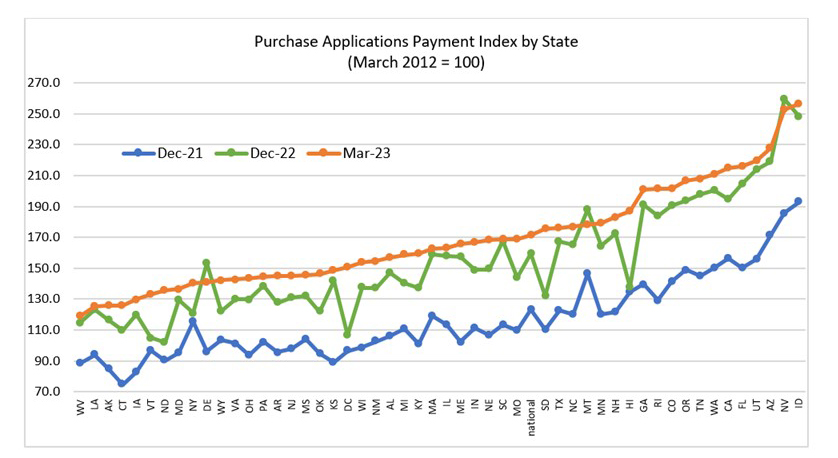
• States with the highest PAPI were Idaho (256.5), Nevada (252.2), Arizona (227.7), Utah (219.6) and Florida (215.8).
• States with the lowest PAPI were West Virginia (118.9), Louisiana (125.3), Alaska (125.9), Connecticut (126.1) and Iowa (129.8).
• Homebuyer affordability decreased for Black households, with the national PAPI increasing from 173.1 in February to 175.8 in March.
• Homebuyer affordability decreased for Hispanic households, with the national PAPI increasing from 157.8 in February to 160.2 in March.
• Homebuyer affordability decreased for White households, with the national PAPI increasing from 169.5 in February to 172.2 in March.
PAPI measures how new monthly mortgage payments vary across time – relative to income – using data from MBA’s Weekly Applications Survey. An increase in PAPI – indicative of declining borrower affordability conditions – means that the mortgage payment to income ratio is higher due to increasing application loan amounts, rising mortgage rates, or a decrease in earnings. A decrease in PAPI – indicative of improving borrower affordability conditions – occurs when loan application amounts decrease, mortgage rates decrease, or earnings increase.
PAPI uses usual weekly earnings data from the U.S. Bureau of Labor Statistics’ Current Population Survey. Usual weekly earnings represent full-time wage and salary earnings before taxes and other deductions and include any overtime pay, commissions or tips usually received. Note that data are not seasonally adjusted.
MBA’s Builders’ Purchase Application Payment Index (BPAPI) uses MBA’s Builder Application Survey data to create an index that measures how new mortgage payments vary across time relative to income, with a focus exclusively on newly built single-family homes. As with PAPI, higher index values indicate that the mortgage payment to income ratio is higher than in a month where the index is lower. To create BPAPI, principal and interest payment amounts are deflated by the same earnings series as in PAPI.
The rent data series calculated for MBA’s national mortgage payment to rent ratio comes from the U.S. Census Bureau’s Housing Vacancies and Homeownership survey’s median asking rent. The HVS data is quarterly, and as such, the mortgage payment to rent ratio will be updated quarterly. Note: MPPR data is not included in this release.
For additional information on MBA’s Purchase Applications Payment Index, click here.