MBA: Mortgage Application Payments Increase 2.5% to $2,165 in May
(Courtesy MBA)
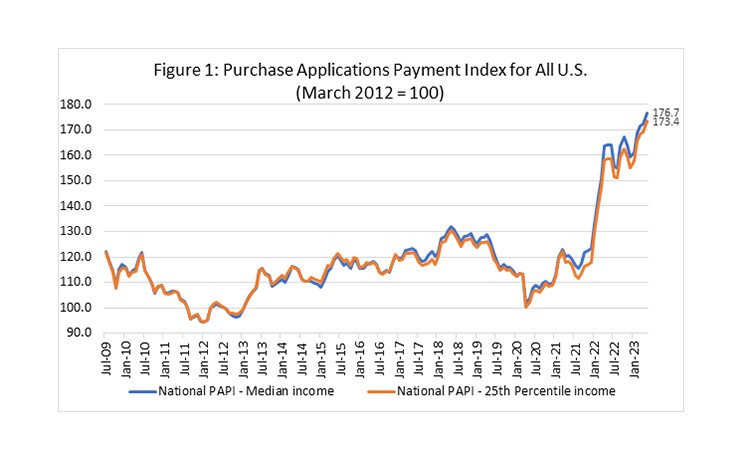
Homebuyer affordability declined further in May, with the national median payment applied for by purchase applicants increasing 2.5% to $2,165 from $2,112 in April. This is according to the Mortgage Bankers Association’s Purchase Applications Payment Index (PAPI), which measures how new monthly mortgage payments vary across time–relative to income–using data from MBA’s Weekly Applications Survey.
“Homebuyer affordability eroded further in May as prospective buyers continue to grapple with high interest rates and low housing inventory,” said Edward Seiler, MBA Associate Vice President of Housing Economics and Executive Director of the Research Institute for Housing America. “While supply remains low, we do expect that inventory will pick up in the near term, which will provide more opportunities for borrowers to buy a home.”
An increase in MBA’s PAPI–indicative of declining borrower affordability conditions–means that the mortgage payment to income ratio is higher due to increasing application loan amounts, rising mortgage rates or a decrease in earnings. A decrease in the PAPI–indicative of improving borrower affordability conditions–occurs when loan application amounts decrease, mortgage rates decrease or earnings increase.
The national PAPI increased 2.5% to 176.7 in May from 172.4 in April. The increase means that the PAPI hit a new record high last month. Compared to May 2022 (163.2), the index is up 7.6%. For borrowers applying for lower-payment mortgages (the 25th percentile), the national mortgage payment increased to $1,462 in May from $1,430 in April.
The Builders’ Purchase Application Payment Index (BPAPI) showed that the median mortgage payment for purchase mortgages from MBA’s Builder Application Survey increased from $2,445 in April to $2,515 in May.
Additional Key Findings of MBA’s Purchase Applications Payment Index (PAPI) – May 2023
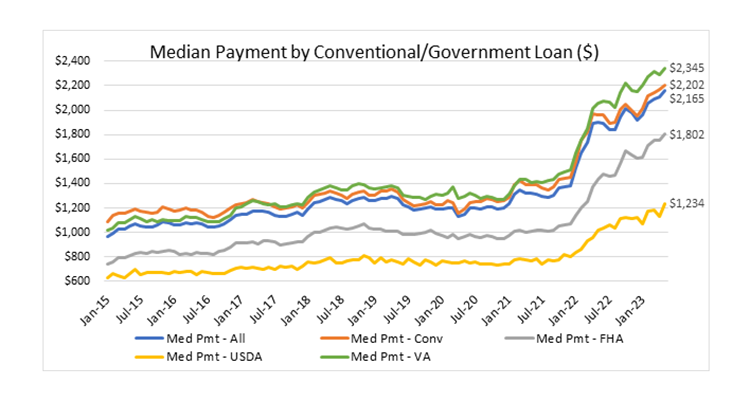
• The national median mortgage payment was $2,165 in May, up from $2,112 in April and from $2,093 in March. It is up $268 from one year ago, equal to a 14.1% increase.
• The national median mortgage payment for FHA loan applicants was $1,802 in May, up from $1,750 in April and up from $1,430 in May 2022.
• The national median mortgage payment for conventional loan applicants was $2,202, up from $2,170 in April and from $1,960 in May 2022.
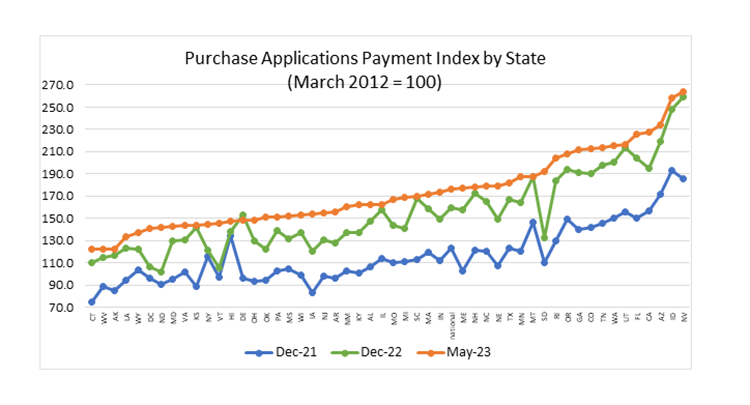
• The top five states with the highest PAPI were: Nevada (263.4), Idaho (258.5), Arizona (234.4), California (227.7), and Florida (225.3).
• The top five states with the lowest PAPI were: Connecticut (122.2), West Virginia (122.6), Alaska (122.6), Louisiana (133.7), and Wyoming (136.8).
• Homebuyer affordability decreased for Black households, with the national PAPI increasing from 176.7 in April to 181.1 in May.
• Homebuyer affordability decreased for Hispanic households, with the national PAPI increasing from 161.1 in April to 165.1 in May.
• Homebuyer affordability decreased for White households, with the national PAPI increasing from 173.0 in April to 177.3 in May.
About MBA’s Purchase Applications Payment Index
The Mortgage Bankers Association’s Purchase Applications Payment Index measures how new mortgage payments vary across time relative to income. Higher index values indicate that the mortgage payment to income ratio is higher than in a month where the index is lower. Contrary to other affordability indexes that make multiple assumptions about mortgage underwriting criteria to estimate mortgage payment level, PAPI directly uses MBA’s Weekly Applications Survey data to calculate mortgage payments.
PAPI uses usual weekly earnings data from the U.S. Bureau of Labor Statistics’ Current Population Survey. Usual weekly earnings represent full-time wage and salary earnings before taxes and other deductions and include any overtime pay, commissions, or tips usually received. Note that data are not seasonally adjusted.
MBA’s Builders’ Purchase Application Payment Index uses MBA’s Builder Application Survey data to create an index that measures how new mortgage payments vary across time relative to income, with a focus exclusively on newly built single-family homes. As with PAPI, higher index values indicate that the mortgage payment to income ratio (PIR) is higher than in a month where the index is lower. To create BPAPI, principal and interest payment amounts are deflated by the same earnings series as in PAPI.
The rent data series calculated for MBA’s national mortgage payment to rent ratio comes from the U.S. Census Bureau’s Housing Vacancies and Homeownership survey’s median asking rent. The HVS data is quarterly, and as such, the mortgage payment to rent ratio will be updated quarterly. The MPRR was not included in the May 2022 data.
For additional information on MBA’s Purchase Applications Payment Index, click here.