MBA Chart of the Week July 10, 2023
The U.S. Census Bureau released updated construction spending survey data. Also referred to as the Value of Construction Put in Place, the survey covers all private residential construction and improvements, non-residential construction, and public construction.
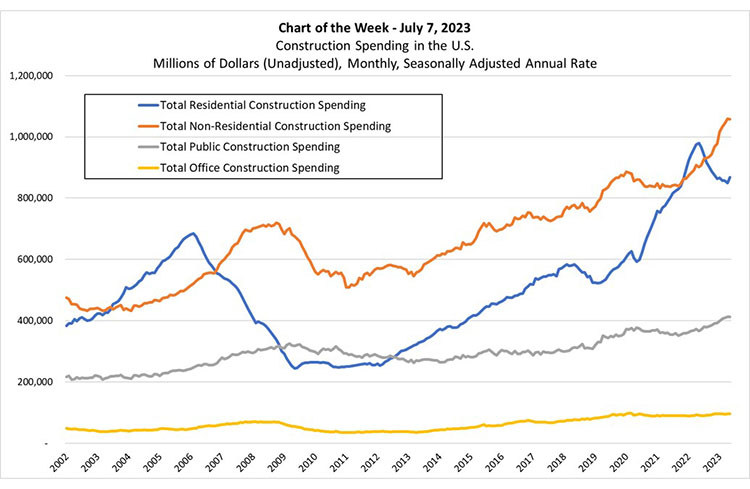
Total construction spending in the U.S. increased by 0.9% from April to May 2023, reaching an annualized $1.926 trillion. It was 2.4% higher than in May 2022 and was driven by non-residential construction that was up by 17.3% (orange line) year over year. Indeed, non-residential VIP growth was in double digits for seven of the sixteen categories reported, and manufacturing construction increased by 76.9% year over year.
Last week’s Chart of the Week highlighted the reset the office market is going through and the uncertainty about office norms. This week’s chart corroborates this view. Office construction spending, represented by the yellow line, hit a high of $97 billion in February 2020. It has plateaued since a period of strong growth in non-residential construction spending.
Public construction (gray line) reached $412 billion in May 2023, up from $367 billion in May 2022, with the largest two categories—Highway and Street, and Educational increasing 14.2% and 5.9%, respectively, year over year.
Private residential construction—which makes up 98.8% of total residential construction—gives us a view into new single-family construction, new multifamily construction, and residential improvements. In May, of the $857 billion in private residential construction, $371 billion were in single-family construction, and $128 billion in multifamily construction. This means that $358 billion was spent on residential improvements.
Residential VIP has trended upwards since its trough in the mid $200 billion range from 2010-2012, reaching a high of $979 billion in May 2022, as housing market dynamics changed due to a combination of the pandemic, rapid home price appreciation, and low mortgage rates. It fell precipitously from that high to $849 billion in April but recovered 2.1% to $868 billion in May.
On the residential side, we expect new construction activity to grow over the next two years, driven by resilient housing demand, a shortage of entry-level housing, and an aging housing stock in need of replenishment.