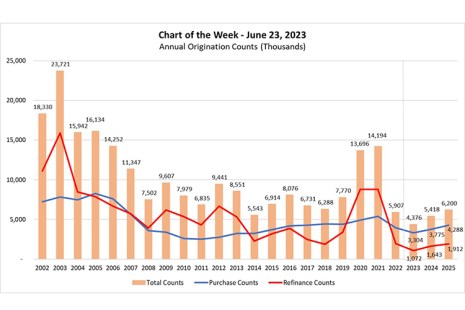
2020 and 2021 were record setting years with $4.11 trillion and $4.44 trillion in originations respectively, as the industry experienced record low mortgage rates and home price appreciation soared across the country.
Tag: MBA Chart of the Week
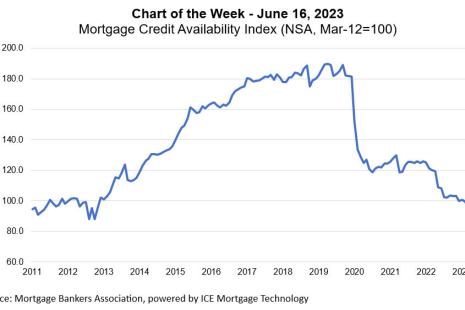
MBA Chart of the Week June 20, 2023: Mortgage Credit Availability Index
According to data from MBA’s May 2023 Mortgage Credit Availability Index (MCAI), we saw the third consecutive month of declining credit availability, as the industry continued to see more consolidation and reduced capacity as a result of the tougher market.
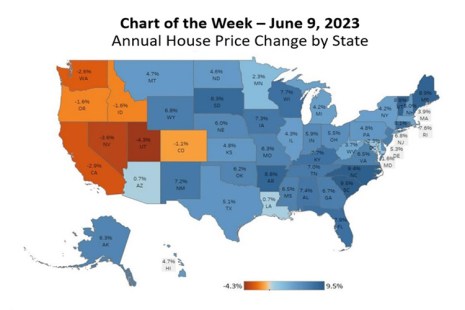
MBA Chart of the Week June 12, 2023: Annual House Price Change by State
National house price growth has cooled drastically since reaching a high of 18.5 percent in the third quarter of 2021, with first quarter 2023 house price appreciation coming in at 4.3%.
MBA Chart of the Week June 12, 2023: Annual House Price Change by State
National house price growth has cooled drastically since reaching a high of 18.5 percent in the third quarter of 2021, with first quarter 2023 house price appreciation coming in at 4.3%.
MBA Chart of the Week June 12, 2023: Annual House Price Change by State
National house price growth has cooled drastically since reaching a high of 18.5 percent in the third quarter of 2021, with first quarter 2023 house price appreciation coming in at 4.3%.
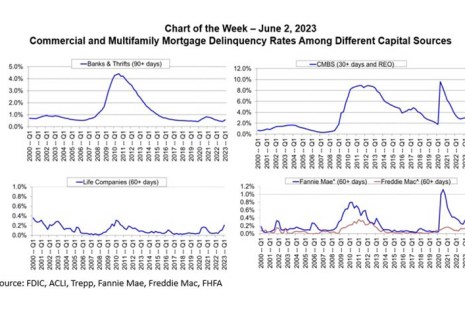
MBA Chart of the Week June 5: Commercial and Multifamily Delinquency Rates Among Capital Sources
Ongoing stress caused by higher interest rates, uncertainty around property values and questions about fundamentals in some property markets are beginning to show up in commercial mortgage delinquency rates.
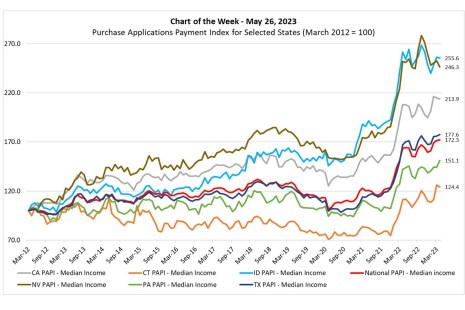
MBA Chart of the Week May 30, 2023: Affordability Continues to Erode
MBA recently released its April Purchase Applications Payment Index (PAPI), which revealed that affordability continued to erode in the first four months of 2023.
MBA Chart of the Week May 30, 2023: Affordability Continues to Erode
MBA recently released its April Purchase Applications Payment Index (PAPI), which revealed that affordability continued to erode in the first four months of 2023.