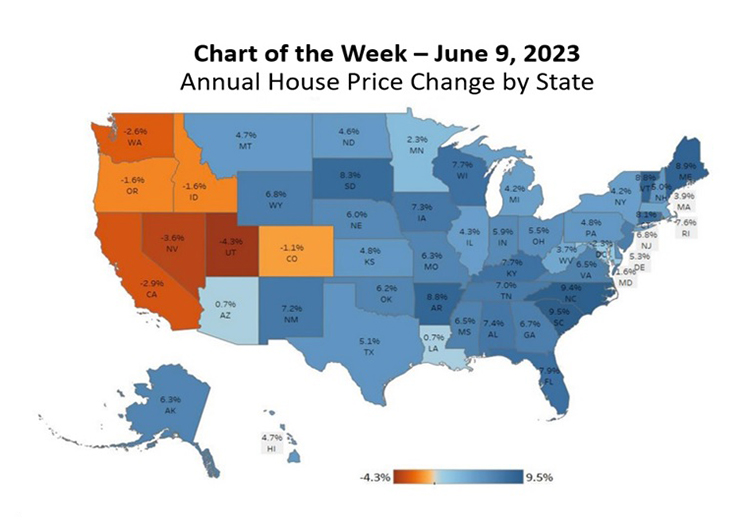
MBA Chart of the Week June 12, 2023: Annual House Price Change by State
(Source: Federal Housing Finance Agency)
National house price growth has cooled drastically since reaching a high of 18.5 percent in the third quarter of 2021, with first quarter 2023 house price appreciation coming in at 4.3%. These are annual or four quarter percent changes, based on the Federal Housing Finance Agency’s (FHFA) Purchase-Only House Price Index data.
Our current forecast is for national home prices to decline by 0.6 percent in Q4 2023 relative to Q4 2022. While initially thought to be too bullish with our forecast last year, in hindsight, we were too pessimistic and expect to revise our house price forecast in the months ahead given the continuing lack of inventory.
This week, we look at state level house price trends from Q1 2023, which show significant geographical differences. From the FHFA’s first quarter report, 43 states saw annual price increases. Several western states showed annual declines, while states in the middle of the country out to the east coast are still seeing moderate to even robust price growth in some cases.
Much of this can be explained by the reversal of rapid acceleration in house prices over the prior two years to unsustainable levels as demand dropped, and in many cases, this demand shifted to other markets. The lack of affordable options, and mortgage rates increasing from 3% to beyond 7%, reduced purchasing power, but homebuyers who were still in the market shifted their focus to less expensive markets, in turn supporting the price growth in those markets.
The five states that led the nation in price appreciation were South Carolina (9.5 percent), North Carolina (9.4 percent), Maine (8.9 percent), Vermont (8.8 percent), and Arkansas (8.8 percent). The states showing the highest annual depreciation were Utah (-4.3 percent), Nevada (-3.6 percent), California (-2.9 percent), Washington (-2.6 percent), and the District of Columbia (-2.3 percent).
We expect the highest cost markets will continue to experience less price growth from slowing demand, with growth shifted to more affordable markets. Additionally, the shortage of for-sale inventory will likely ease through a combination of increasing levels of newly built homes and existing inventory being freed up as current homeowners eventually sell to move elsewhere. As we look ahead to the next year and beyond, the focus should be on state and local market level drivers of housing market activity and price trends.