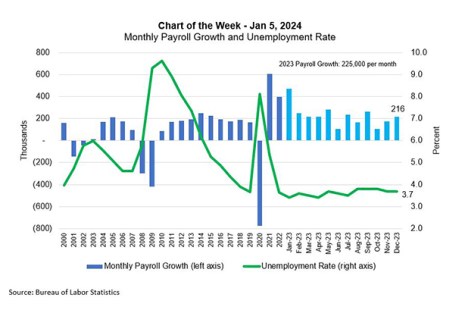
Friday’s report from the Bureau of Labor Statistics showed that the job market remained relatively strong in December, with growth in payrolls of 216,000 – just below the monthly average of 225,000 for full-year 2023.
Tag: MBA Chart of the Week

MBA Chart of the Week: 30-Year Fixed Rate
As we summarize the state of the mortgage market in 2023, there is one series in particular that encapsulates the situation, mortgage interest rates.
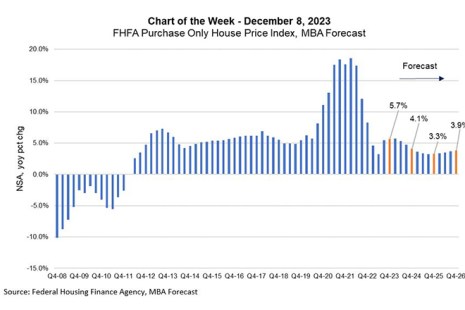
MBA Chart of the Week: FHFA Purchase Only House Price Index; MBA Forecast
This week’s Chart of the Week shows the historical national home price growth and MBA’s forecast through 2026.
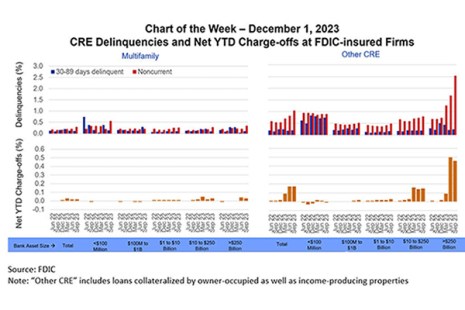
MBA Chart of the Week: CRE Delinquencies and Net YTD Charge-offs at FDIC-Insured Firms
Since March 2023, a recurring set of questions has revolved around a) how conditions in commercial real estate are affecting banks and b) how conditions with banks are affecting CRE.
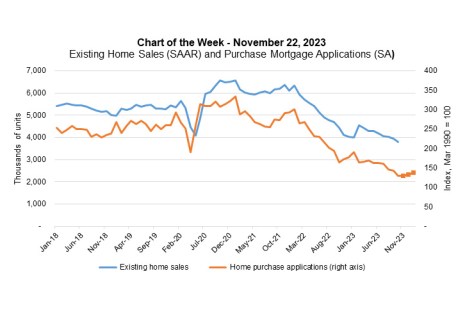
MBA Chart of the Week: Existing Home Sales (SAAR) and Purchase Mortgage Applications (SA)
This week’s MBA Chart of the Week highlights the paths of existing home sales and purchase applications over the past five years.
MBA Chart of the Week: Existing Home Sales (SAAR) and Purchase Mortgage Applications (SA)
This week’s Chart of the Week highlights the paths of existing home sales and purchase applications over the past five years.
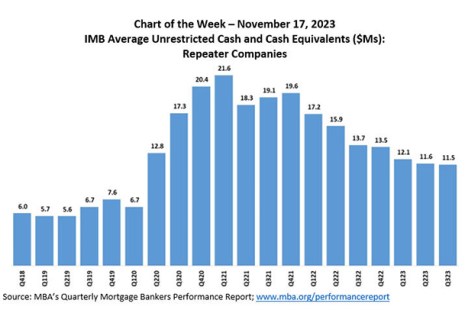
MBA Chart of the Week: IMB Average Unrestricted Cash & Cash Equivalents
MBA Research recently released the third quarter results of its Quarterly Mortgage Bankers Performance Report. The results showed that independent mortgage banks and bank subsidiaries reported a pre-tax net loss of $1,015 on each loan they originated in the third quarter of 2023, an increase from the reported loss of $534 per loan in the second quarter of 2023.
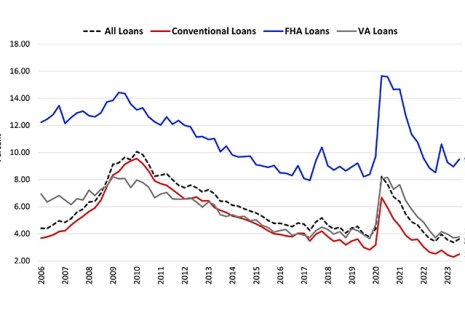
MBA Chart of the Week: Delinquency Rates by Loan Type, Conventional, FHA, VA
According to the latest MBA National Delinquency Survey, the overall delinquency rate for mortgage loans on one‐to‐four‐unit residential properties increased to 3.62 percent of all loans outstanding at the end of the third quarter of 2023.

MBA Chart of the Week: Monthly Payroll Growth and Unemployment Rate
This week’s Chart of the Week highlights the October Employment Situation results released Friday.

MBA Chart of the Week: Actual and Modeled CRE Lending ($Billions)
MBA’s latest commercial real estate finance (CREF) forecast anticipates 2023 origination volumes ($442 billion) will come in just a bit more than half of what they were in 2022 ($816 billion).