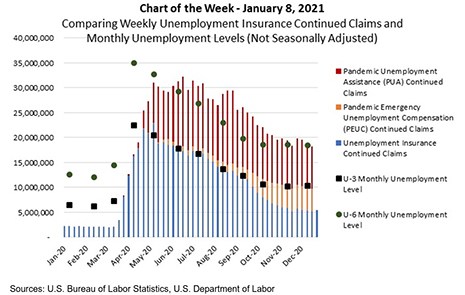
The COVID-19 pandemic continued to impact the labor market to close 2020. Friday’s release from the Bureau of Labor Statistics showed that faster layoffs led to a loss of 140,000 jobs in December and kept the headline unemployment rate (U-3) at 6.7 percent.
Tag: MBA Chart of the Week
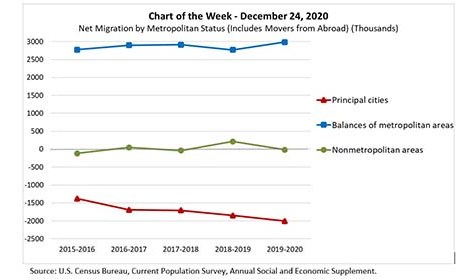
MBA Chart of the Week: Net Migration by Metropolitan Status
This week’s MBA Chart of the Week shows net migration by metropolitan status over the past five years. The green line shows that the net movement into nonmetropolitan areas has hovered around zero, growing by an average of 19,000 migrants (nationally). On the other hand, metropolitan areas absorbed more than 5.7 million migrants over this period.
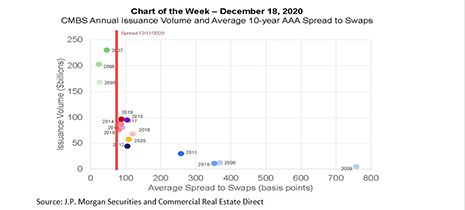
MBA Chart of the Week: CMBS Annual Issuance Volume
One way to gauge potential commercial mortgage-backed securities issuance volume is by looking at the spreads investors are willing to pay for bonds. Based on current new-issue spreads, 2021 could line-up to be a strong year.
MBA Chart of the Week: CMBS Annual Issuance Volume
One way to gauge potential commercial mortgage-backed securities issuance volume is by looking at the spreads investors are willing to pay for bonds. Based on current new-issue spreads, 2021 could line-up to be a strong year.
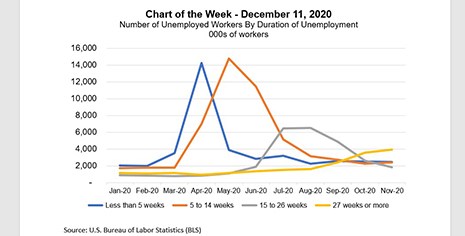
MBA Chart of the Week: Number of Unemployed Workers By Duration of Unemployment
Over the past three months, the pace of job gains has slowed from the rapid recovery seen over the summer. Similarly, the unemployment rate continues to decline, but at a more gradual pace.
MBA Chart of the Week: Number of Unemployed Workers By Duration of Unemployment
Over the past three months, the pace of job gains has slowed from the rapid recovery seen over the summer. Similarly, the unemployment rate continues to decline, but at a more gradual pace.
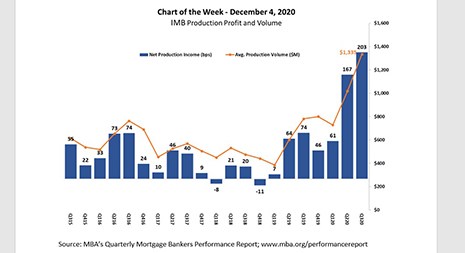
MBA Chart of the Week: IMB Production Profit and Volume
MBA released its latest Quarterly Performance Report for the third quarter last week. Independent mortgage banks and mortgage subsidiaries of chartered banks reported study-high average pre-tax production profits of 203 basis points ($5,535 on each loan originated) in the third quarter, up from 167 basis points ($4,548 per loan) in the second quarter.
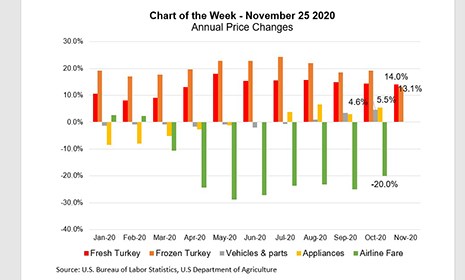
MBA Chart of the Week: Annual Price Gains
Our Thanksgiving-themed Chart of the Week highlights the strength in turkey price growth in 2020, along with year-over-year price changes for a few other goods categories.