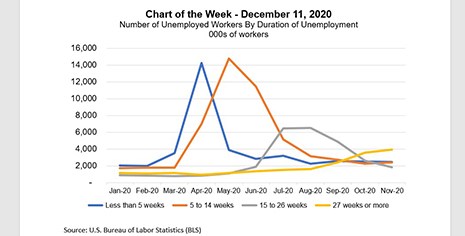
Over the past three months, the pace of job gains has slowed from the rapid recovery seen over the summer. Similarly, the unemployment rate continues to decline, but at a more gradual pace.
Tag: MBA Chart of the Week
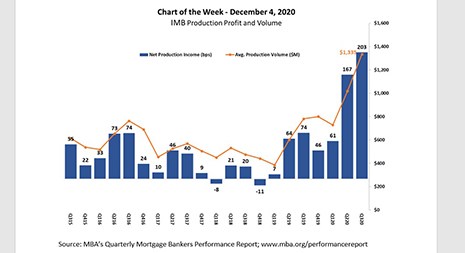
MBA Chart of the Week: IMB Production Profit and Volume
MBA released its latest Quarterly Performance Report for the third quarter last week. Independent mortgage banks and mortgage subsidiaries of chartered banks reported study-high average pre-tax production profits of 203 basis points ($5,535 on each loan originated) in the third quarter, up from 167 basis points ($4,548 per loan) in the second quarter.
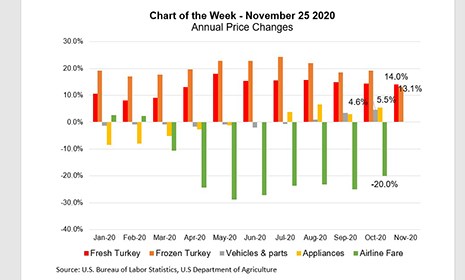
MBA Chart of the Week: Annual Price Gains
Our Thanksgiving-themed Chart of the Week highlights the strength in turkey price growth in 2020, along with year-over-year price changes for a few other goods categories.
MBA Chart of the Week: Annual Price Gains
Our Thanksgiving-themed Chart of the Week highlights the strength in turkey price growth in 2020, along with year-over-year price changes for a few other goods categories.
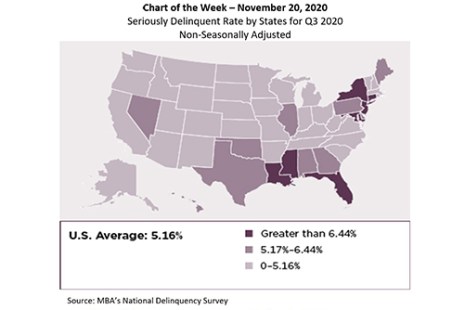
MBA Chart of the Week: Seriously Delinquent Rate by States for Q3 2020
MBA released its National Delinquency Survey results for the third quarter last week. This week’s chart highlights the seriously delinquent rate – the percentage of loans that are 90 days or more delinquent or in the process of foreclosure – in every state across the country.
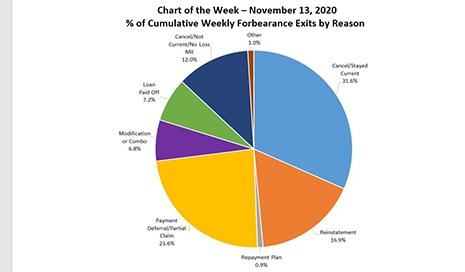
MBA Chart of the Week: Percentage of Cumulative Weekly Forbearance Exits by Reason
According to the latest edition of MBA’s Weekly Forbearance and Call Volume Survey, the share of loans in forbearance dropped to 5.67 percent of servicers’ portfolio volume as of November 1 — well below its peak of 8.55 percent as of June 7.
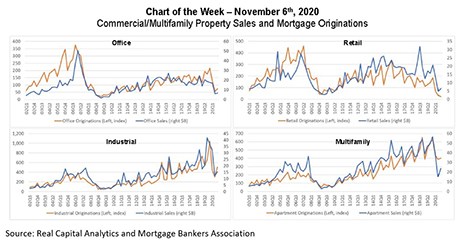
MBA Chart of the Week: Commercial/Multifamily Property Sales & Mortgage Originations
Commercial and multifamily mortgage origination volumes tend to move nearly in lockstep with property sales activity. With the onset of the COVID-19 pandemic, both tumbled, but with some important caveats.