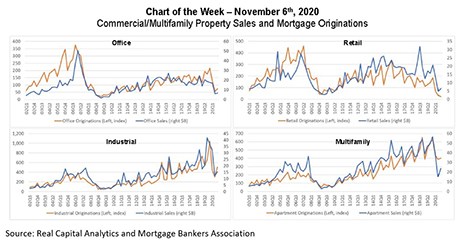
Commercial and multifamily mortgage origination volumes tend to move nearly in lockstep with property sales activity. With the onset of the COVID-19 pandemic, both tumbled, but with some important caveats.
Tag: MBA Chart of the Week
MBA Chart of the Week: Indexed Levels of GDP
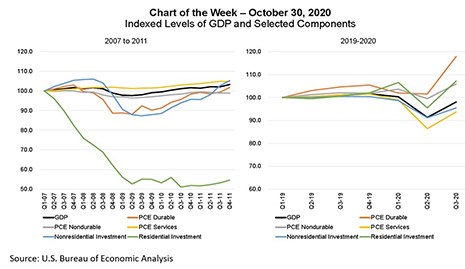
This week’s chart compares the 2008-2010 Great Recession (left), to the recent pandemic-driven recession (right), to illustrate the differences in consumer spending and in both nonresidential and residential investment.
MBA Chart of the Week: Indexed Levels of GDP
This week’s chart compares the 2008-2010 Great Recession (left), to the recent pandemic-driven recession (right), to illustrate the differences in consumer spending and in both nonresidential and residential investment.
MBA Chart of the Week: Missed Payments By Month (Q2-Q3)
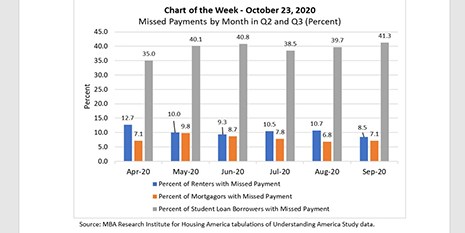
This week’s MBA Chart of the Week chart provides fresh third quarter 2020 insights on the Research Institute for Housing America’s special report released in September that highlighted household financial distress during the second quarter—the first three months of the pandemic.
MBA Chart of the Week: Missed Payments By Month (Q2-Q3)
This week’s MBA Chart of the Week chart provides fresh third quarter 2020 insights on the Research Institute for Housing America’s special report released in September that highlighted household financial distress during the second quarter—the first three months of the pandemic.
MBA Chart of the Week: Appetite for Commercial/Multifamily
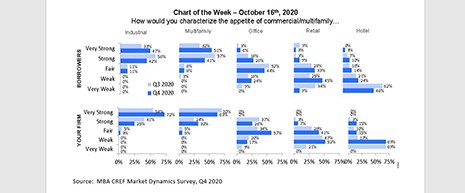
CRE mortgage demand is generally on the rise, with four times more firms expecting borrower demand to be “very strong” in the fourth quarter (24%), compared to the 6% who believed demand was “very strong” in the third quarter.
MBA Chart of the Week: Appetite for Commercial/Multifamily
CRE mortgage demand is generally on the rise, with four times more firms expecting borrower demand to be “very strong” in the fourth quarter (24%), compared to the 6% who believed demand was “very strong” in the third quarter.
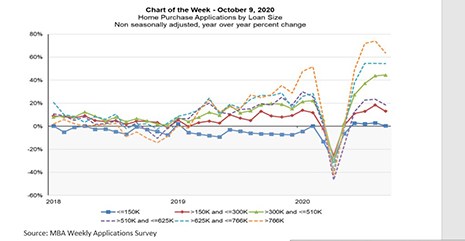
MBA Chart of the Week: Home Purchase Activity by Loan Size
This week’s MBA Chart of the Week highlights the year-over-year growth in purchase applications broken down by loan size tiers from 2018 to 2020.
MBA Chart of the Week: Home Purchase Activity by Loan Size
This week’s MBA Chart of the Week highlights the year-over-year growth in purchase applications broken down by loan size tiers from 2018 to 2020.
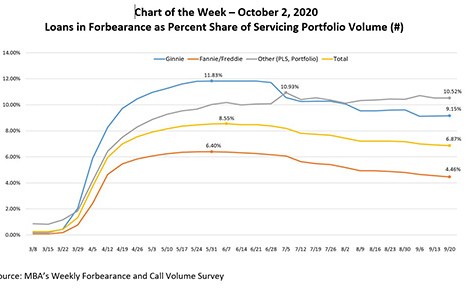
MBA Chart of the Week: Loans in Forbearance as Share of Servicing Portfolio Volume
According to the latest edition of MBA’s Weekly Forbearance and Call Volume Survey, released last week, the share of loans in forbearance dropped to 6.87 percent of servicers’ portfolio volume as of September 20. The share was the lowest point since mid-April, and 168 basis points below a peak of 8.55 percent during the week ending June 7.