The pace of economic growth, as measured by gross domestic product in the first quarter, picked up to a 6.4 percent annualized rate – the biggest first-quarter increase since 1984.
Tag: MBA Chart of the Week
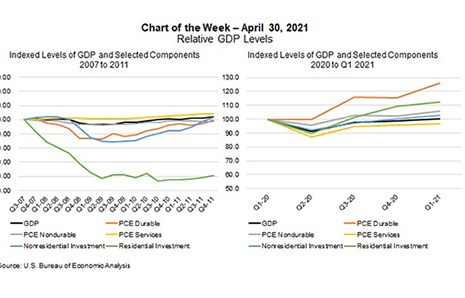
MBA Chart of the Week: Relative GDP Levels
The pace of economic growth, as measured by gross domestic product in the first quarter, picked up to a 6.4 percent annualized rate – the biggest first-quarter increase since 1984. We expect that pace to accelerate further over the next 6 months, as households unleash the pent-up demand for a range of goods and services.
MBA Chart of the Week: Home Purchase Applications By Loan Size
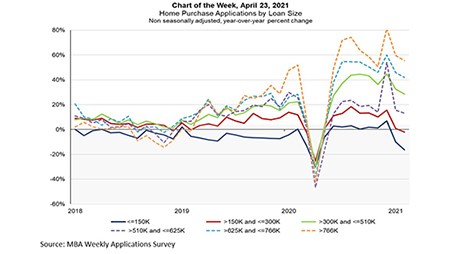
This week’s MBA Chart of the Week examines year-over-year growth in purchase loan applications by loan size since 2018.
MBA Chart of the Week: Home Purchase Applications By Loan Size
This week’s MBA Chart of the Week examines year-over-year growth in purchase loan applications by loan size since 2018.
MBA Chart of the Week: New Home Sales, Single-Family Housing Starts
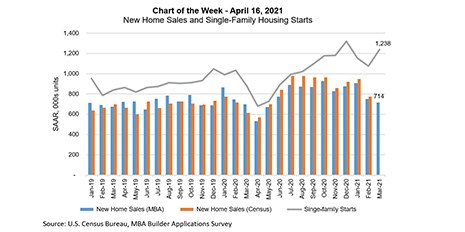
This week’s MBA Chart of the Week focuses on newly built homes, as measured by new home sales and single-family housing starts.
MBA Chart of the Week: New Home Sales, Single-Family Housing Starts
This week’s MBA Chart of the Week focuses on newly built homes, as measured by new home sales and single-family housing starts.
MBA Chart of the Week Apr. 12 2021: Monthly Payroll Growth/Unemployment Rate
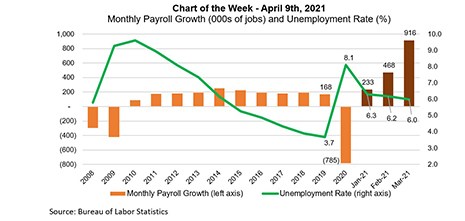
This week’s chart summarizes the recent strength of the job market. According to the Bureau of Labor Statistics, job growth accelerated sharply in March, as the economy gained 916,000 jobs over the month, the largest monthly gain since August 2020.
MBA Chart of the Week Apr. 12 2021: Monthly Payroll Growth/Unemployment Rate
This week’s chart summarizes the recent strength of the job market. According to the Bureau of Labor Statistics, job growth accelerated sharply in March, as the economy gained 916,000 jobs over the month, the largest monthly gain since August 2020.
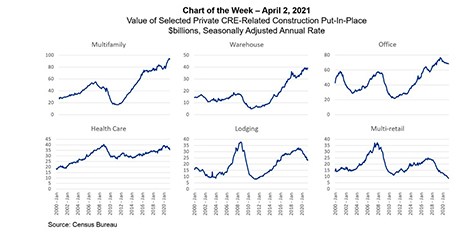
MBA Chart of the Week Apr. 5, 2021: Value of CRE Construction
One of the most striking aspects of the COVID-19 pandemic’s impact on commercial and multifamily real estate has been the disparity in the ways different property types have been affected. MBA’s monthly CREF Loan Performance Survey continues to show the immediate and dramatic rise in delinquency rates among lodging and retail properties.