MBA Chart of the Week: New Home Sales, Single-Family Housing Starts
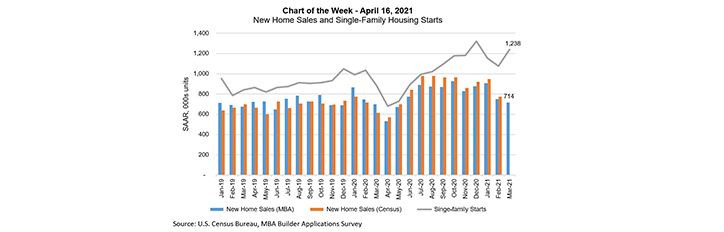
This week’s MBA Chart of the Week focuses on newly built homes, as measured by new home sales and single-family housing starts.
As indicated in our monthly Builder Applications Survey release, MBA’s estimate of new home sales declined by more than 4 percent in March to a seasonally adjusted annual pace of 714,000 units, the slowest pace since May 2020. Sales were held back by rapidly increasing home prices and a low number of homes on the market, caused by a combination of strong demand for new homes outpacing supply, as well as supply chain challenges facing homebuilders. BAS data has proven to be a reliable indicator of the U.S. Census Bureau’s new home sales release. The chart above shows how the two series have moved closely together.
The chart also features the Census’ measure of single-family housing starts, which increased 15 percent in March to more than 1.2 million units. On a year-over-year basis, single-family starts were up more than 40 percent in March, the 10th consecutive month of annual gains. The March employment numbers from the Bureau of Labor Statistics showed a pickup in construction employment, with strong gains in both residential construction and specialty contractor hiring. Those job gains were matched by a notable increase in the overall pace of building.
The biggest challenge facing the housing market right now is the lack of housing supply. Today’s news of more new inventory on the way is very positive, both from the addition of new units, but also with the potential to free-up existing inventory as people move. Although we do not expect a rapid cooling in the pace of home-price growth, there should be some deceleration over the course of 2021 as these additional units enter the market.
–Anh Doan (adoan@mba.org); Mike Fratantoni (mfratantoni@mba.org); Joel Kan (jkan@mba.org)