MBA Research recently wrapped up its annual Servicing Operations Study, a deep dive analysis of servicing costs, productivity, portfolio activity and operational metrics for in-house servicers. In this week’s chart, we show 2020 direct servicing costs allocated by functional area.
Tag: MBA Chart of the Week
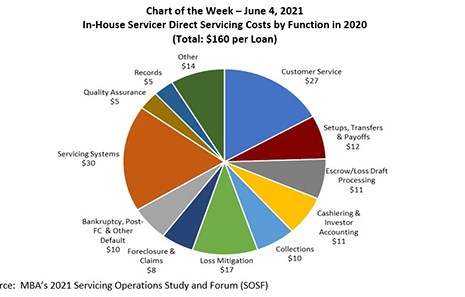
MBA Chart of the Week June 7, 2021: In-House Servicer Direct Servicing Costs by Function in 2020
MBA Research recently wrapped up its annual Servicing Operations Study, a deep dive analysis of servicing costs, productivity, portfolio activity and operational metrics for in-house servicers. In this week’s chart, we show 2020 direct servicing costs allocated by functional area.
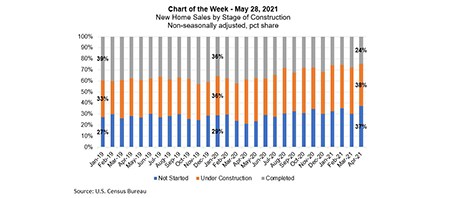
MBA Chart of the Week June 1 2021: New Home Sales By Stage of Construction
This week’s MBA Chart of the Week shows that there is a declining share of completed homes (24 percent) and a growing share of homes sold that were either still under construction (38 percent) or not started (37 percent).
MBA Chart of the Week June 1 2021: New Home Sales By Stage of Construction
This week’s MBA Chart of the Week shows that there is a declining share of completed homes (24 percent) and a growing share of homes sold that were either still under construction (38 percent) or not started (37 percent).
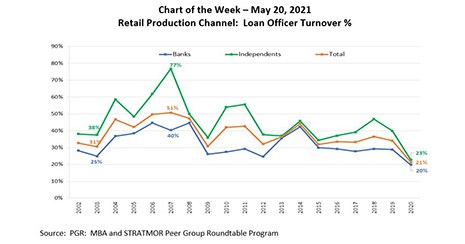
MBA Chart of the Week May 24 2021: Retail Production Channel Loan Officer Turnover
This week’s chart shows the historical retail Loan Officer turnover rates (%) for depository banks and independent mortgage companies, based on data collected through the MBA and STRATMOR Peer Group Roundtable Program, now in its 23rd year of production.
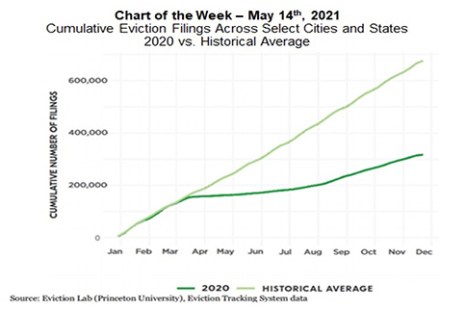
MBA Chart of the Week May 17, 2021: Cumulative Eviction Filings, 2020 v. Historical Average
On Wednesday, May 5, U.S. District Court Judge Dabney Friedrich issued an order vacating the U.S. Centers for Disease Control and Prevention’s national eviction moratorium. But with the number of Covid-19 cases, hospitalizations and deaths falling, increased attention is being paid to when, and how, to allow the various moratoriums to phase-out.
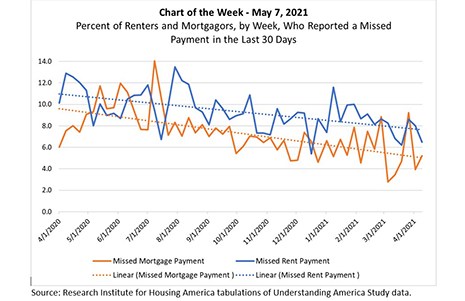
MBA Chart of the Week, May 7, 2021: Renters/Mortgagors & Missed Payments
The Research Institute for Housing America, MBA’s think tank, released updated first-quarter results that allow us to assess how renters, mortgagors and student loan borrowers fared over the first 12 months of the COVID-19 pandemic.