On Friday, January 7, the U.S. Department of Treasury released its latest monthly update on allocation of funds from the Emergency Rental Assistance program.
Tag: MBA Chart of the Week
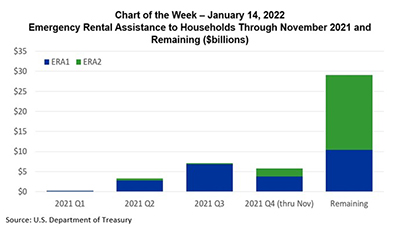
MBA Chart of the Week: Emergency Rental Assistance to Households
On Friday, January 7, the U.S. Department of Treasury released its latest monthly update on allocation of funds from the Emergency Rental Assistance program.
MBA Chart of the Week Jan. 7 2022: Insured Employment 2020-2021
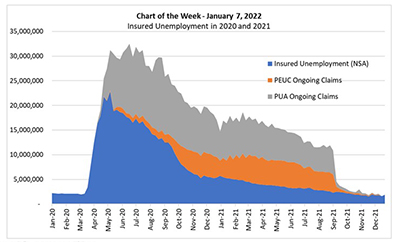
This week’s MBA Chart of the Week highlights the steep rise in insured unemployment at the start of the pandemic (March 2020) and its steady decline through the fall of 2021 as the labor market improved (and related government financial support to households waned).
MBA Chart of the Week Jan. 7 2022: Insured Employment 2020-2021
This week’s MBA Chart of the Week highlights the steep rise in insured unemployment at the start of the pandemic (March 2020) and its steady decline through the fall of 2021 as the labor market improved (and related government financial support to households waned).
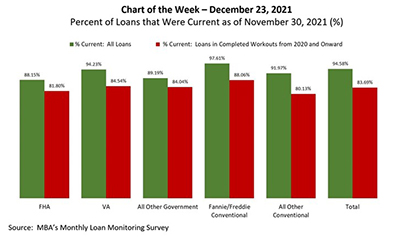
MBA Chart of the Week Dec. 23 2021: Percent of Current Loans
According to the MBA Monthly Loan Monitoring Survey, the share of loans in forbearance dropped to 1.67 percent of servicers’ portfolio volume as of November 30, after climbing to a monthly peak of 8.53 percent in May 2020.
MBA Chart of the Week Dec. 17 2021: Federal Reserve Dot Plots
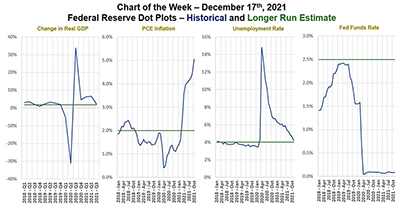
This week’s MBA Chart of the Week traces the Federal Open Market Committee forecasts and long-run estimates of four key metrics that contribute to Fed decision-making and communication – GDP, inflation, unemployment and the Fed funds rate.
MBA Chart of the Week Dec. 17 2021: Federal Reserve Dot Plots
This week’s MBA Chart of the Week traces the Federal Open Market Committee forecasts and long-run estimates of four key metrics that contribute to Fed decision-making and communication – GDP, inflation, unemployment and the Fed funds rate.
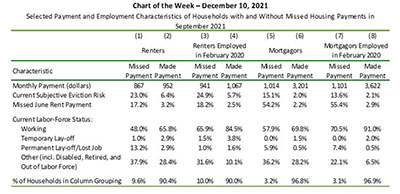
MBA Chart of the Week: Payment & Employment Characteristics
This week’s MBA Chart of the Week zeroes in on selected payment and employment characteristics of households who made and missed their rent and mortgage payments in September.
MBA Chart of the Week: Payment & Employment Characteristics
This week’s MBA Chart of the Week zeroes in on selected payment and employment characteristics of households who made and missed their rent and mortgage payments in September.
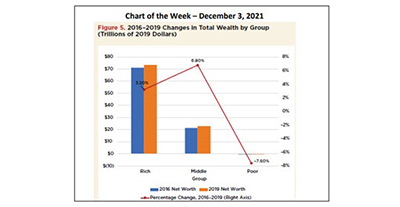
MBA Chart of the Week, Dec. 3, 2021: U.S. Household Wealth
This week’s MBA Chart of the Week shows that the net wealth of the rich, the top 10% of households, increased by 3.2% between 2016 and 2019, while the net worth of the poor, the bottom 30% of households, decreased by 7.6%.