
While overall mortgage delinquencies were relatively flat compared to last year, earlier-stage delinquencies declined while serious delinquencies – those loans 90 or more days delinquent or in foreclosure – increased.
Tag: MBA Chart of the Week
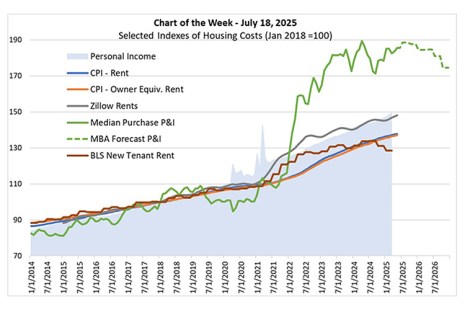
Chart of the Week: Selected Indexes of Housing Costs
MBA forecasts that house price appreciation will continue to moderate in the coming quarters.

MBA Chart of the Week: Housing Units Available For Sale
Inadequate housing supply has been a well-documented challenge for the housing market in recent years. However, there are recent signs that for-sale inventory in many parts of the country has started to grow again.

Chart of the Week: Target and Projected Fed Funds Rate
Federal Open Market Committee (FOMC) projections from the June 2025 meeting show that members expect increases in both the unemployment rate and inflation throughout the course of this year, as well as slightly weaker economic growth.

MBA Chart of the Week: YTD 2025 Purchase Applications
Nationally, aggregate purchase applications have been showing year-over-year growth since late January, a sign that demand has picked up, and the data tend to have a higher coverage of existing home purchases.

Chart of the Week: MOVE Volatility Index and Mortgage-Treasury Spread
Market volatility, both in equity and bond markets, increased sharply last week because of the serial surprises with respect to the direction of U.S. tariff policy.

Chart of the Week: Effect of 2025 Announced Tariffs on Household Disposable Income
Since World War II, the consensus among economists has been pro-free trade with the attitude to tariffs summed up by JP Morgan’s David Kelly:

Chart of the Week: New Home Sales by Stage of Construction
As home builders have increased production levels to meet recent demand for homes, residential housing starts and permits, and new home sales have continued at a relatively strong pace through early 2025.
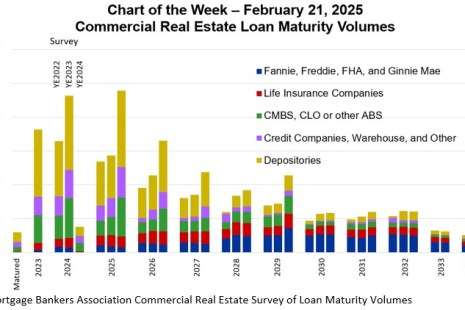
Chart of the Week: CRE Loan Maturity Volumes
Twenty percent ($957 billion) of $4.8 trillion of outstanding commercial mortgages held by lenders and investors will mature in 2025, a 3 percent increase from 2024, according to MBA’s 2024 Commercial Real Estate Survey of Loan Maturity Volumes.
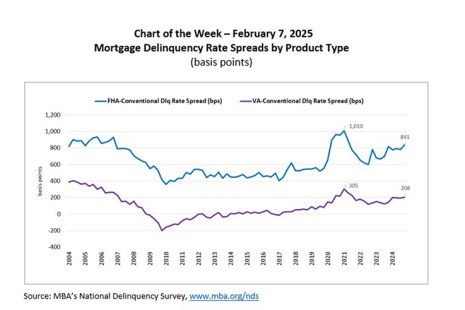
Chart of the Week: Mortgage Delinquency Rate Spreads by Product Type
According to the MBA’s National Delinquency Survey, the overall delinquency rate for mortgage loans on one‐to‐four‐unit residential properties increased to a seasonally adjusted rate of 3.98% of all loans outstanding at the end of the fourth quarter.