MBA Chart of the Week: Housing Units Available For Sale
Source: Census Bureau, National Association of Realtors
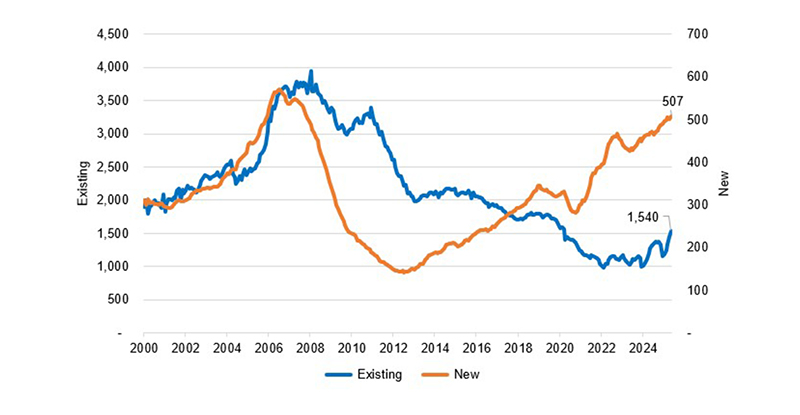
Inadequate housing supply has been a well-documented challenge for the housing market in recent years. However, there are recent signs that for-sale inventory in many parts of the country has started to grow again. Inventory of existing or previously owned homes has been low due to an aging housing stock and underbuilding, exacerbated by the mortgage rate “lock in” effect, where homeowners with low mortgage rates from 2020 and 2021 are not listing their homes to hold on to these lower rates.
Over the past few months, existing inventory has risen from historical lows of under 1 million units to 1.54 million units, the highest level in five years. While still below historical averages, this has provided a boost to purchase activity, as buyers now have options to consider, despite the uncertain economic times.
The inventory of newly built homes has grown steadily since hitting a post-GFC low but this is a smaller segment of the housing market, accounting for 25% of total housing inventory. Newly built homes provided good alternatives for homebuyers from 2020 to 2024, when existing inventory was at its lowest, but there have recently been signs of weakening in that segment. Inventory levels are at the 500,000-unit mark as the pace of new home sales has cooled off and as more existing units become available for sale.
Consistent with loosening inventory conditions, home price growth has started to moderate in many parts of the country. The Federal Housing Finance Agency’s (FHFA) measure of home price growth for April 2025 showed that overall prices in the US declined in April relative to the previous month and were 3 percent higher than a year ago. The monthly decline was the first since 2022, and the annual growth rate was the lowest since 2023, due to increasing for-sale inventory and a pullback in demand culminating in less upward pressure on prices. There were significant geographic differences in price growth, ranging from 0.5% to 7.4% in terms of annual growth rates, as inventory conditions varied by location. The Midwest and Northeast continue to see tight inventory conditions and stronger home price growth. In comparison, Sunbelt states have generally seen more inventory growth and more rapidly moderating home price growth.
However, affordability challenges remain for many homebuyers, as relative to income growth, median mortgage principal and interest (P&I) payments remain elevated with mortgage rates close to 7%, based on MBA’s Purchase Applications Payment Index (PAPI). In May 2025, the PAPI was nearly 6% lower than a year ago, but approximately 30% higher than its pre-2022 average. The median P&I for May was $2,211.
In sum, MBA’s forecast is for gradual growth in home sales and purchase originations for 2025 and 2026, although we have revised these estimates lower given current economic uncertainty and expectations of lower economic growth and a weaker job market in our June forecast.
–Mike Fratantoni (mfratantoni@mba.org); Joel Kan (jkan@mba.org)