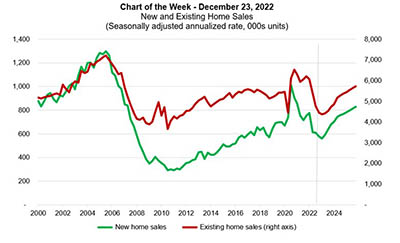
We are forecasting a weak start to 2023 for the housing market. Driven by a recession in the first half of the year and a continuation of the trends outlined above, we expect a 13% drop in existing home sales and a 4% decrease in new home sales for 2023, following 16% decreases in both segments in 2022.
Tag: MBA Chart of the Week
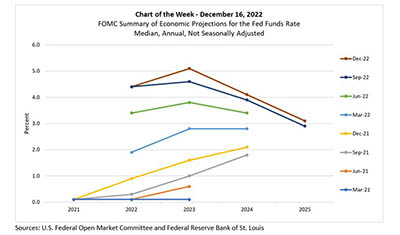
MBA Chart of the Week Dec. 16, 2022: Federal Funds Rate Projections
In an effort to increase transparency after the Great Recession, one of the Federal Open Market Committee communication initiatives under Chairman Ben Bernanke was to publish individual members’ assessments of the economy in the Summary of Economic Projections. In this week’s MBA Chart of the Week, we track changes in policymakers’ quarterly published SEP forecasts of the federal funds rate over the past eight quarters.
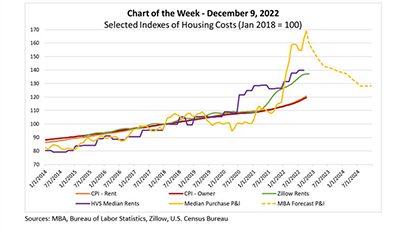
MBA Chart of the Week, Dec. 9, 2022: Housing Cost Indices
Housing costs are – appropriately – getting a lot of attention. Part of that attention stems from affordability challenges heightened by recent rapid increases in home prices, interest rates and rents. Another part stems from the fact that shelter costs are such a significant driver of measures of inflation, and thus a key motivator of Federal Reserve policies. In this week’s Chart of the Week, we examine selected indices of housing costs.
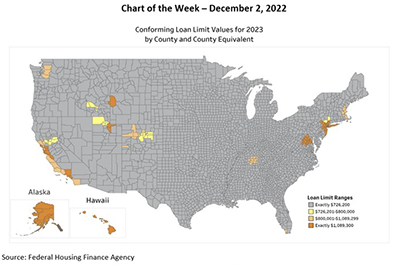
MBA Chart of the Week Dec. 2, 2022: GSE Conforming Loan Limits
Last week, the Federal Housing Finance Agency announced conforming loan limits for mortgages eligible to be acquired by Fannie Mae and Freddie Mac in 2023. The 2023 loan limit for one-unit properties for most of the country will be $726,200, an increase of $79,000 from $647,200 in 2022.
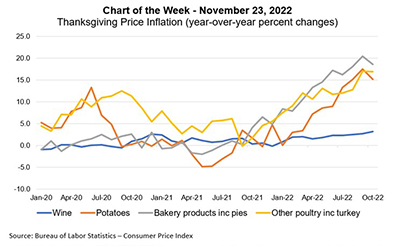
MBA Chart of the Week: Thanksgiving Price Inflation
Our Thanksgiving edition of Chart of the Week focuses on four major food and beverage items popular for the occasion – turkey, potatoes, baked goods and wine. Consistent with the broader inflationary environment, prices for these products, as measured by the Consumer Price Index have seen significant growth over the past year.
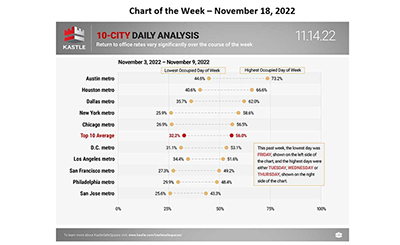
MBA Chart of the Week Nov. 18, 2022: Return to Office Rates
This week’s Chart of the Week highlights data from Kastle Systems for November 3-9, showing the range of daily occupancy rates for 10 major metros. For these metros, the lowest average occupancy rate for a particular day of the week was 32.2 percent, and the highest was 56.0 percent, compared to essentially 100 percent occupancy pre-pandemic for most days.