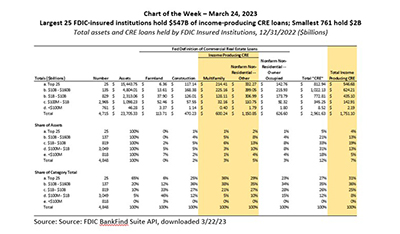
There is, not inappropriately, a great deal of attention being paid to commercial real estate right now. And with that attention come a lot of different questions and answers—with many answers varying depending on how one defines things.
Tag: MBA Chart of the Week
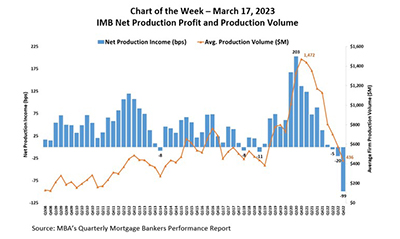
MBA Chart of the Week Mar. 17, 2023: IMB Net Profits, Production Volume
In this MBA Chart of the Week, we look at production profits in basis points, relative to average production volume, from inception of the MBA Quarterly Mortgage Bankers Performance Report series in third quarter 2008 through fourth quarter 2022.
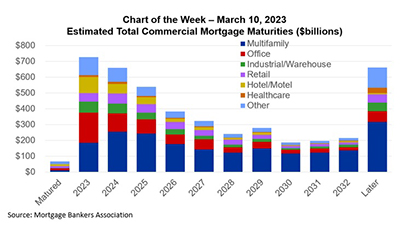
MBA Chart of the Week March 13 2023–Estimated Total Commercial Mortgage Maturities
At MBA’s CREF Convention in San Diego last month, we released the results of our annual survey of upcoming commercial and multifamily mortgage maturities. The survey collects information directly from loan servicers on when the loans they service mature.
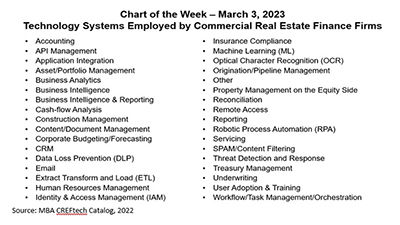
MBA Chart of the Week March 3 2023–Tech Systems Employed by Commercial Real Estate Finance Firms
This week’s Chart of the Week presents findings from MBA’s CREF Technology Catalog, showing the areas in which firms are applying specific tech solutions. What is clear in looking at the industry is that CREF has always relied heavily on technology and does so more and more each year.
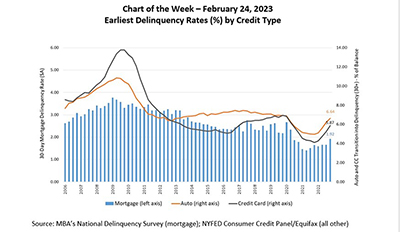
MBA Chart of the Week Feb. 24 2023–Delinquency Rates by Credit Type
The latest credit delinquency data from both MBA and other sources indicates that delinquencies are rising. In MBA’s National Delinquency Survey, covering national and state delinquencies through the fourth quarter of 2022 revealed that the delinquency rate for mortgage loans on one‐to‐four‐unit residential properties rose to a seasonally adjusted rate of 4.96 percent of all loans outstanding at the end of the fourth quarter.
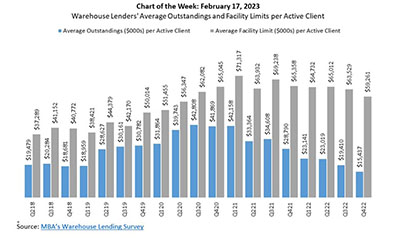
MBA Chart of the Week Feb. 17, 2023: Warehouse Lending
According to MBA’s latest Warehouse Lending Survey, warehouse lenders – as of the end of fourth-quarter 2022 – reported an average outstanding balance of $15.4 million per active client on their warehouse lines for first mortgages held for sale. This marks the fifth consecutive quarterly decline in per-client outstandings