MBA: August Homebuyer Affordability Up 3rd Straight Month
Homebuyer affordability improved in August for the third straight month, with the national median payment applied for by applicants decreasing to $1,839 from $1,844 in July, according to the Mortgage Bankers Association’s Purchase Applications Payment Index.

“Most of the country saw modest improvements in homebuyer affordability for the third straight month because of slightly lower mortgage rates amidst steady income growth,” said Edward Seiler, MBA Associate Vice President of Housing Economics, and Executive Director of the MBA Research Institute for Housing America. “The healthy labor market continues to be a positive for the housing market, despite ongoing economic uncertainty and high inflation.”
Seiler noted higher mortgage rates have reduced borrowers’ purchasing power since the start of the year. “The median loan amount in August was $313,500, down from a peak of $340,000 in February,” he said. “The recent stretch of modest affordability improvement likely hit a speedbump this month, as mortgage rates have jumped to around 6 percent.”
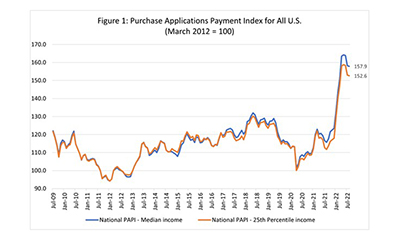
The national PAPI (Figure 1) decreased 0.3 percent to 157.9 in August from 158.3 in July, meaning payments on new mortgages take up a smaller share of a typical person’s income. Compared to August 2021 (115.7), the index has jumped 36.5 percent. For borrowers applying for lower-payment mortgages (the 25th percentile), the national mortgage payment between July and August 2022 was unchanged at $1,210.
The PAPI measures how new monthly mortgage payments vary across time – relative to income – using data from MBA’s Weekly Applications Survey. An increase in MBA’s PAPI – indicative of declining borrower affordability conditions – means the mortgage payment to income ratio () is higher due to increasing application loan amounts, rising mortgage rates, or a decrease in earnings. A decrease in the PAPI – indicative of improving borrower affordability conditions – occurs when loan application amounts decrease, mortgage rates decrease or earnings increase.
Additional Key Findings of the MBA Purchase Applications Payment Index – August
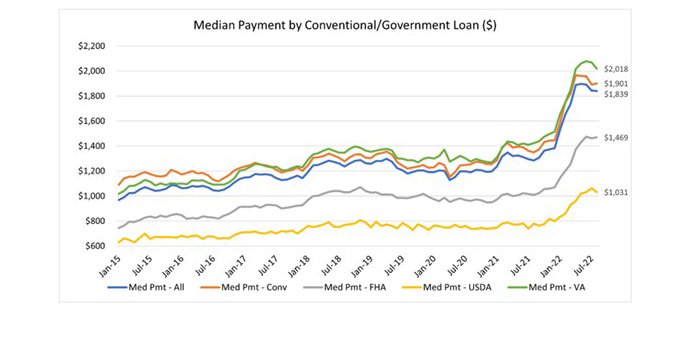
- The national median mortgage payment fell to$1,839 in August, down from $1,844 in July and $1,893 in June. Monthly payments are still up by $456 in the first eight months of the year – equal to a 33.0% increase.
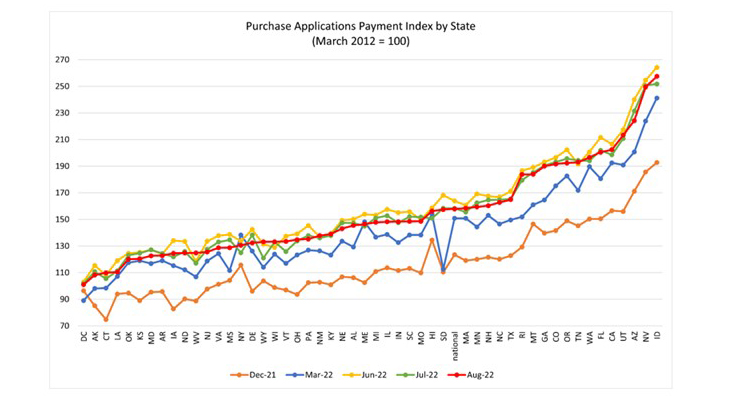
- Of 50 states (and Washington, D.C.), 32 had lower PAPI values in August than in July. This includes six of the top 10 states with the highest PAPI values.
- The national median mortgage payment for FHA loan applicants rose to $1,469 in August, up from $1,461 in July and up from $1,009 in August 2021.
- The national median mortgage payment for conventional loan applicants rose to $1,901, up from $1,892 in July and up from $1,350 in August 2021.
- States with the highest PAPI were Idaho (257.5), Nevada (249.4), Arizona (224.2), Utah (213.3) and California (202.4).
- States with the lowest PAPI were Washington, D.C. (101.0), Alaska (108.2), Connecticut (108.9), Louisiana (110.5) and Oklahoma (120.1).
- Homebuyer affordability increased slightly for Black households, with the national PAPI decreasing from 153.7 in July to 153.3 in August.
- Homebuyer affordability increased slightly for Hispanic households, with the national PAPI decreasing from 149.6 in July to 149.2 in August.
- Homebuyer affordability increased slightly for White households, with the national PAPI decreasing from 159.1 in July to 158.7 in August.
About the MBA’Purchase Applications Payment Index
The Mortgage Bankers Association’s Purchase Applications Payment Index measures how new mortgage payments vary across time relative to income. Higher index values indicate that the mortgage payment to income ratio is higher than in a month where the index is lower. Contrary to other affordability indexes that make multiple assumptions about mortgage underwriting criteria to estimate mortgage payment level, PAPI directly uses MBA’s Weekly Applications Survey data to calculate mortgage payments.
PAPI uses usual weekly earnings data from the U.S. Bureau of Labor Statistics’ Current Population Survey. Usual weekly earnings represent full-time wage and salary earnings before taxes and other deductions and include any overtime pay, commissions, or tips usually received. Note that data are not seasonally adjusted.
The rent data series calculated for MBA’s national mortgage payment to rent ratio comes from the U.S. Census Bureau’s Housing Vacancies and Homeownership survey’s median asking rent. The HVS data is quarterly, and as such, the mortgage payment to rent ratio will be updated quarterly. Note: MPPR data is not included in this September release.
For additional information on MBA’s Purchase Applications Payment Index, click here.