The Research Institute for Housing America, MBA’s think tank, released updated first-quarter results that allow us to assess how renters, mortgagors and student loan borrowers fared over the first 12 months of the COVID-19 pandemic.
Tag: Edward Seiler
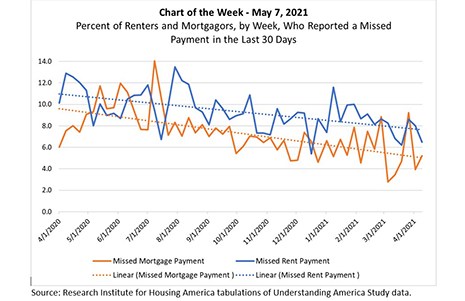
MBA Chart of the Week, May 7, 2021: Renters/Mortgagors & Missed Payments
The Research Institute for Housing America, MBA’s think tank, released updated first-quarter results that allow us to assess how renters, mortgagors and student loan borrowers fared over the first 12 months of the COVID-19 pandemic.
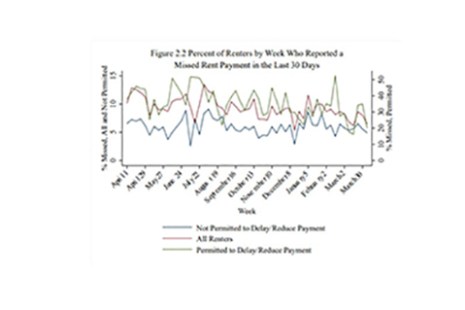
RIHA: Less Than 10% of Homeowners, Renters Have Missed Multiple Payments During Pandemic
Slightly under five million households did not make their rent or mortgage payments in March, an improvement from December 2020 and the lowest number since the onset of the COVID-19 pandemic, new research from the Mortgage Bankers Association’s Research Institute for Housing America reported.
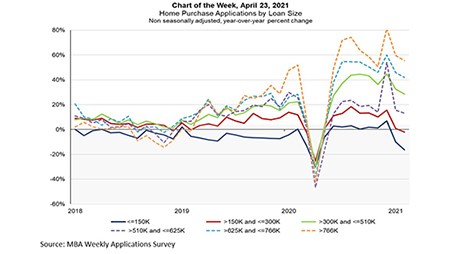
MBA Chart of the Week: Home Purchase Applications By Loan Size
This week’s MBA Chart of the Week examines year-over-year growth in purchase loan applications by loan size since 2018.
MBA Chart of the Week: Home Purchase Applications By Loan Size
This week’s MBA Chart of the Week examines year-over-year growth in purchase loan applications by loan size since 2018.
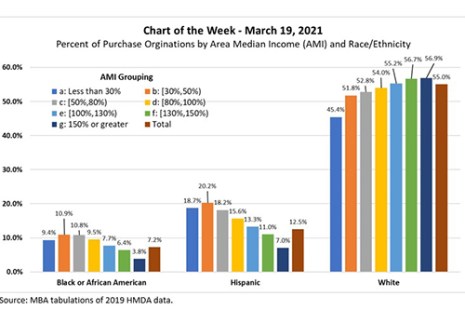
MBA Chart of the Week: Percent of Originations by Median Income, Race/Ethnicity
We analyzed the 2019 Home Mortgage Disclosure Act data for the 30 largest metropolitan statistical areas to understand the distributions of first lien mortgage purchase originations by Area Median Income and by race/ethnicity.
MBA RIHA Study: Affordability Growing Challenge for Low-, Moderate-Income Renters in Majority of Top 50 Metro Areas
Home prices and rent appreciation have exceeded income growth since the turn of the 21st century. This has created economic obstacles for many American households, especially for low- and moderate-income renters living in cities with recent employment growth but significant housing supply constraints, according to a new report from the MBA Research Institute for Housing America.