MBA Chart of the Week: Percent of Originations by Median Income, Race/Ethnicity
On March 25, the Federal Housing Finance Agency will hold a public listening session as part of its rulemaking process to establish Enterprise housing goal benchmarks for 2022-2024. Currently, the single-family low-income home purchase goal is based on mortgages to families with incomes less than or equal to 80% area median income. The low-income areas home purchase subgoal includes families with incomes less than or equal to 100% AMI who live in Census tracts with a minority population of at least 30%, and a tract median income of less than 100% AMI.
Given FHFA’s upcoming listening session and MBA’s commitment to work with and encourage policymakers to support policies and programs that help create wealth through increased minority homeownership, we analyzed the 2019 Home Mortgage Disclosure Act data for the 30 largest metropolitan statistical areas to understand the distributions of first lien mortgage purchase originations by AMI and by race/ethnicity.
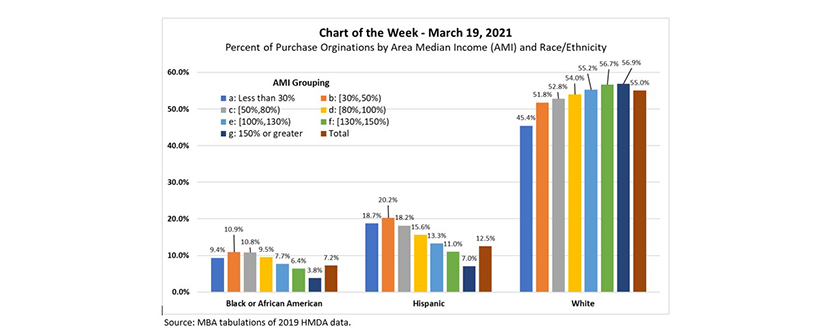
This week’s MBA Chart of the Week chart shows these distributions for all loan types (government, conventional non-jumbo, and conventional jumbo). For example, Black/African American households accounted for 7.2% of all 2019 originations examined, and almost 11% of the loans to households with incomes in the 30-50% and the 50-80% AMI ranges. Interestingly, they also accounted for (a disproportionate) 9.5% and 7.7% of the originations to families with incomes in the 80-100% and 100-130% AMI ranges. The pattern is similar for Hispanic households, while White households demonstrated an increasing share of originations as the AMI range groupings increase, with almost 57% of the originations for families with incomes above 150% AMI.
When we restrict the data to conventional non-jumbo loans, Black and Hispanic households with incomes less than 100% AMI accounted for a higher (than their overall) share of the originations, but as opposed to the case for all loan types, not for the 100-130% AMI range. However, when we drill down to individual MSAs the patterns vary, and 13 of the 30 MSAs display a larger-than-average share of originations to Black/African American families in the 100-130% AMI range.
–Edward Seiler eseiler@mba.org.