Slightly under five million households did not make their rent or mortgage payments in the second quarter, updated research from the Mortgage Bankers Association’s Research Institute for Housing America reported.
Tag: Edward Seiler
MBA RIHA: Fewer Households Missed Housing Payments in Second Quarter
Slightly under five million households did not make their rent or mortgage payments in the second quarter, updated research from the Mortgage Bankers Association’s Research Institute for Housing America reported.
MBA RIHA: Fewer Households Missed Housing Payments in Second Quarter
Slightly under five million households did not make their rent or mortgage payments in the second quarter, updated research from the Mortgage Bankers Association’s Research Institute for Housing America reported.
MBA RIHA: Fewer Households Missed Housing Payments in Second Quarter
Slightly under five million households did not make their rent or mortgage payments in the second quarter, updated research from the Mortgage Bankers Association’s Research Institute for Housing America reported.
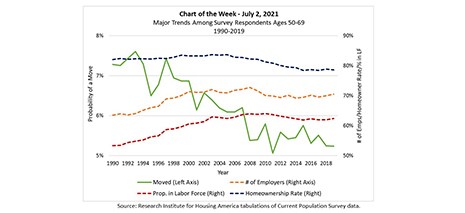
MBA Chart of the Week July 6 2021: Older Workers’ Labor Force Participation
The Research Institute for Housing America, MBA’s think tank, released a special report that examines why, since the 1990s, older workers’ labor force participation has increased while their migration has decreased, counter to conventional economic wisdom.

MBA RIHA Study: Older Homeowners, College-Educated Individuals More Likely to Leave Workforce After Job Loss
Older college-educated homeowners are two times more likely to leave the workforce after a job loss than renters, according to a new research report released Tuesday by the Mortgage Bankers Association’s Research Institute for Housing America.
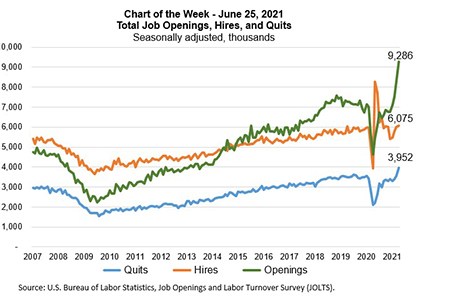
MBA Chart of the Week June 28 2021: Total Job Openings, Hires and Quits
In this week’s MBA Chart of the Week, we examine the monthly data series on job openings, hires and separations produced by the U.S. Bureau of Labor Statistics’ Job Openings and Labor Turnover Survey (JOLTS) program.
MBA Chart of the Week June 28 2021: Total Job Openings, Hires and Quits
In this week’s MBA Chart of the Week, we examine the monthly data series on job openings, hires and separations produced by the U.S. Bureau of Labor Statistics’ Job Openings and Labor Turnover Survey (JOLTS) program.