Last week, the Federal Housing Finance Agency released its Purchase-Only House Price Index for July. The HPI was down 0.6% from the previous month, although up 13.9% from July 2021. The HPI has increased by nearly 120% since March 2012 (yellow line), and is up 39% since the start of the COVID-19 pandemic in March 2020.
Tag: MBA Purchase Applications Payment Index
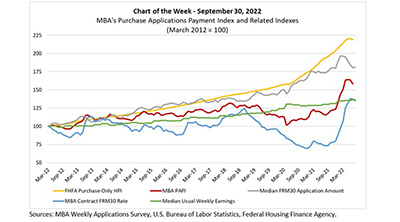
MBA Chart of the Week Sept. 30, 2022: MBA Purchase Applications Payment Index
Last week, the Federal Housing Finance Agency released its Purchase-Only House Price Index for July. The HPI was down 0.6% from the previous month, although up 13.9% from July 2021. The HPI has increased by nearly 120% since March 2012 (yellow line), and is up 39% since the start of the COVID-19 pandemic in March 2020.
MBA: August Homebuyer Affordability Up 3rd Straight Month
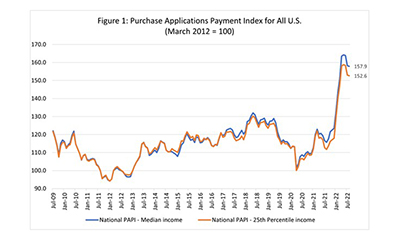
Homebuyer affordability improved in August for the third straight month, with the national median payment applied for by applicants decreasing to $1,839 from $1,844 in July, according to the Mortgage Bankers Association’s Purchase Applications Payment Index.
MBA: August Homebuyer Affordability Up 3rd Straight Month
Homebuyer affordability improved in August for the third straight month, with the national median payment applied for by applicants decreasing to $1,839 from $1,844 in July, according to the Mortgage Bankers Association’s Purchase Applications Payment Index.
MBA, Trade Groups Urge National Economic Council to Support FHA Insurance Premium Reduction
The Mortgage Bankers Association and other industry trade groups urged the National Economic Council to support a reduction of the annual mortgage insurance premium for borrowers with FHA-insured loans.
MBA Chart of the Week, Aug. 26, 2022: MBA Purchase Applications Payment Index
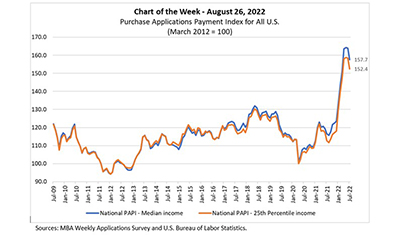
In this MBA Chart of the Week, we examine how market transitions are affecting homebuyer affordability.
MBA Chart of the Week, Aug. 26, 2022: MBA Purchase Applications Payment Index
In this MBA Chart of the Week, we examine how market transitions are affecting homebuyer affordability.
MBA: Lower Mortgage Rates, Loan Amounts Improve July Homebuyer Affordability in 47 States
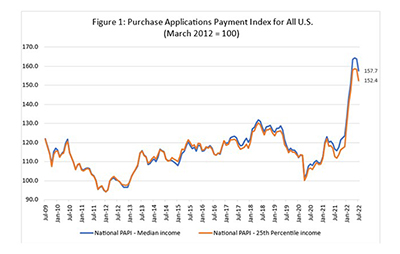
Homebuyer affordability improved for the second straight month in July, with the national median payment applied for by applicants decreasing to $1,844 from $1,893 in June, the Mortgage Bankers Association reported Wednesday.
MBA: Lower Mortgage Rates, Loan Amounts Improve July Homebuyer Affordability in 47 States
Homebuyer affordability improved for the second straight month in July, with the national median payment applied for by applicants decreasing to $1,844 from $1,893 in June, the Mortgage Bankers Association reported Wednesday.
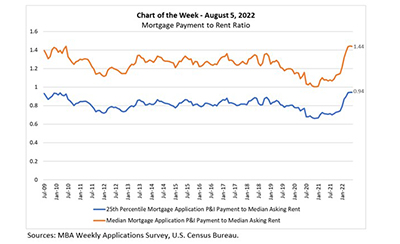
MBA Chart of the Week Aug. 8, 2022: Mortgage Payment to Rent Ratio
This MBA Chart of the Week examines the relationship between mortgage payments and asking rents since the second half of 2009. MBA’s national mortgage payment to rent ratio compares the national median and 25th percentile mortgage payments to the national median asking rent.