MBA Chart of the Week, Aug. 26, 2022: MBA Purchase Applications Payment Index
Homebuyer demand has faltered this summer, as lingering economic uncertainty, high inflation, and still-high mortgage rates caused many prospective buyers to delay their home search. Indeed, mortgage applications are at a 22-year low, held down by not only significantly reduced refinancing demand but also weak home purchase activity.
MBA‘s latest economic and mortgage market forecasts for August reflect these changes, with national home-price appreciation predicted to decelerate from 17.9% (year-over-year) in the second quarter to 9.9% in the fourth quarter of 2022. Similarly, purchase mortgage originations are forecast to fall from $477 billion in the second quarter to $392 billion in the fourth quarter.
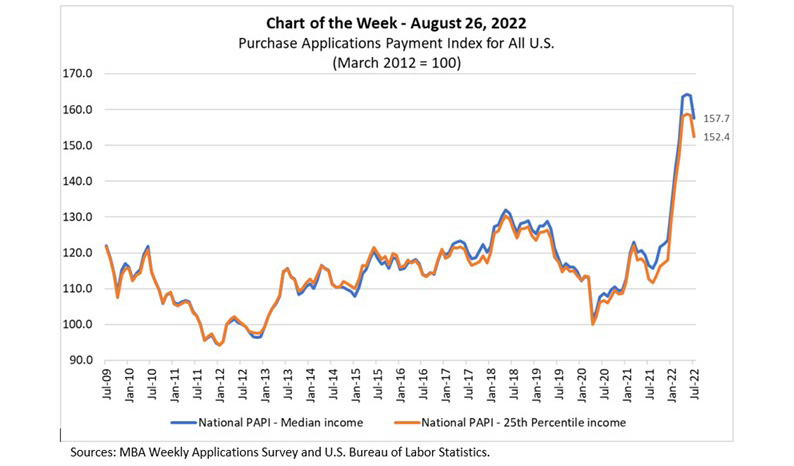
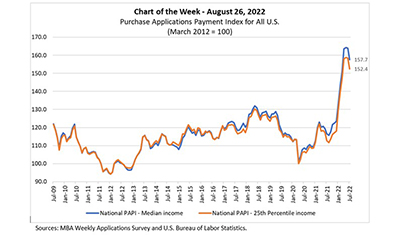
In this week’s MBA Chart of the Week, we examine how these market transitions are affecting homebuyer affordability. The latest Purchase Applications Payment Index, released on Thursday, shows that the meteoric increase in the national PAPI from 123.5 in December 2021 to 164.2 in May 2022 (blue line) – indicating sharply lower affordability – reversed in June (to 163.9), and fell to 157.7 in July. The 3.8% drop in the national index level from June and July means that payments on new mortgages are taking up a smaller share of a typical person’s income – driven by both a lower median application amount ($311,920 vs. $318,750) and a slightly lower interest rate (down 4 basis points). With that said, the PAPI is still near its record high, and compared to July 2021 (116.6), the index has jumped 35.2%.
The pattern is similar for lower income borrowers (the 25th percentile) applying for home purchase mortgages with the PAPI value remaining elevated at 152.4 (orange line). The lower orange line since March 2020 reveals that the cumulative increase in weekly earnings for the 25th percentile earner has been higher than for the median earner since the start of the pandemic.
The moderation in the PAPI over the last two months is widespread. Indeed, out of 50 states (and Washington, D.C.), 47 had lower PAPI values in July than in June. This includes nine of the top 10 states with the highest PAPI values.
MBA Research will continue to closely monitor the PAPI and housing affordability as market conditions continue to evolve.
–Edward Seiler eseiler@mba.org