Today’s Chart of the Week compares the percentage of companies in the QPR that reported positive pre-tax net income including all lines of business (e.g. production and servicing operations), versus the percentage of companies that reported positive pre-tax net income, once servicing operations are excluded.
Tag: MBA Chart of the Week
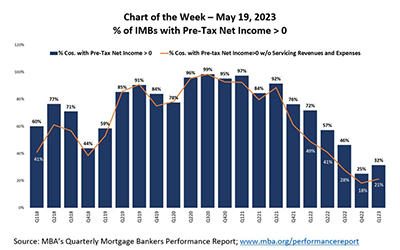
MBA Chart of the Week May 19, 2023: % of IMBs with Pre-Tax Net Income
Today’s Chart of the Week compares the percentage of companies in the QPR that reported positive pre-tax net income including all lines of business (e.g. production and servicing operations), versus the percentage of companies that reported positive pre-tax net income, once servicing operations are excluded.
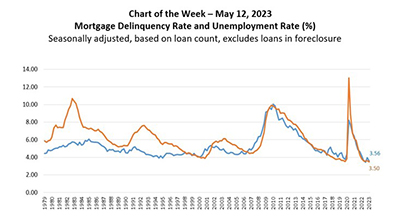
MBA Chart of the Week May 12, 2023: Mortgage Delinquency Rate, Unemployment Rate
This week’s chart shows that mortgage delinquencies and the unemployment rate continue to track each other closely.
MBA Chart of the Week May 12, 2023: Mortgage Delinquency Rate, Unemployment Rate
This week’s chart shows that mortgage delinquencies and the unemployment rate continue to track each other closely.
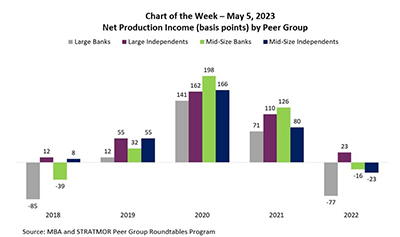
MBA Chart of the Week May 5, 2023: Net Production Income by Peer Group
In this week’s MBA Chart of the Week, we look at pre-tax net production income from a different source – the MBA and STRATMOR Peer Group Roundtables Program. This program was started in 1998 along with STRATMOR Group and is our most comprehensive data collection – providing results for both banks and independents, and then further divided by volume and business model.
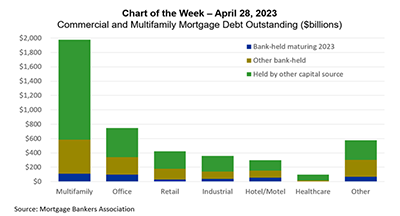
MBA Chart of the Week Apr. 28, 2023: Commercial/Multifamily Mortgage Debt Outstanding
Two questions have dominated the CRE headlines of late: a) the reliance of banks on commercial real estate and b) the reliance of commercial real estate on banks. We addressed the former in a previous Chart of the Week.
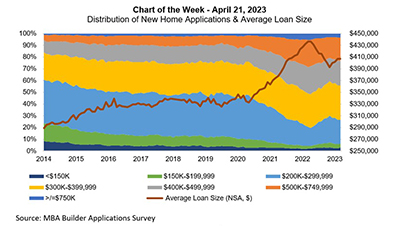
MBA Chart of the Week Apr. 21, 2023–New Home Applications, Average Loan Size
This week’s MBA Chart of the Week delves into builder applications by loan size, to illustrate how the mix of the new home market has changed since 2014.
MBA Chart of the Week Apr. 21, 2023–New Home Applications, Average Loan Size
This week’s MBA Chart of the Week delves into builder applications by loan size, to illustrate how the mix of the new home market has changed since 2014.